THERYA, 2024, Vol. 15(3):279-288 DOI:10.12933/therya-24-6126 ISSN 2007-3364
Mapping core habitats, landscape permeability, and movement corridors for conservation of desert bighorn sheep in Sonora, México
Juan Manuel Segundo Galán1, Erik Joaquín Torres-Romero2, 3*, and Louis C. Bender 4
1 Avenida seis de Abril, No 402, Colonia Ley 57, CP. 83100 Hermosillo. Sonora, México. Email: manuel.segundo@yahoo.com.mx (JMSG).
2 Ingeniería en Biotecnología-Universidad Politécnica de Puebla, San Mateo Cuanalá, Juan C. Bonilla, CP. 72640, Puebla, México.
3 Tecnológico Nacional de México campus Zacapoaxtla. Subdirección de Investigación y Posgrado, División de Biología, Carretera Acuaco-Zacapoaxtla Km. 8, Colonia Totoltepec, CP. 73680, Zacapoaxtla. Puebla, México. Email: ejtr23@hotmail.com (EJTR).
4 Extension Animal Sciences and Natural Resources, New Mexico State University, P.O. Box 30003 MSC 3AE, Las Cruces, New Mexico, USA. Email: lbender@nmsu.edu (LCB).
*Corresponding author: https://orcid.org/0000-0002-1078-9223.
The desert bighorn (Ovis canadensis mexicana) is under Special Protection in México, but populations in Sonora have declined compared to historical levels and are increasingly isolated despite the high economic and ecological value of species. Consequently, we assessed landscape permeability for desert bighorn in Sonora, using data from 39 GPS/satellite-collared individuals. We modeled connectivity and least-cost corridors among 95 % aKDE core areas using Circuitscape and Linkage Mapper software from habitat association maps developed using maximum entropy modelling. We identified a network of 83 potential corridors connecting 43 core areas; corridors ranged from <1 to 165 km in length. We found two distinct areas in desert bighorn range in Sonora: a southern area characterized by high connectivity with shorter corridors of lesser resistance to movements, and a northern area characterized by much lower connectivity with longer corridors of greater resistance; connectivity between these two areas was limited. These results illustrate the isolated distribution of many populations of desert bighorn and the limited connectivity between populations in northern and southern Sonora. Our connectivity maps provide a background for targetting management actions aimed at facilitating the movement and expansion of desert bighorn populations in Sonora. Consequently, they can guide conservation efforts that identify and promote preservation of key patches or corridors; facilitate habitat restorations within and around corridors; and enhance connectivity and thus viability of populations throughout Sonora.
El borrego cimarrón del desierto (Ovis canadensis mexicana) se encuentra bajo Protección Especial en México, pero las poblaciones en Sonora han disminuido en comparación con los niveles históricos y están cada vez más aisladas a pesar del alto valor económico y ecológico de las especies. En consecuencia, evaluamos la permeabilidad del paisaje para el borrego cimarrón del desierto en Sonora, utilizando datos de 39 individuos con collares GPS/satélite. Modelamos la conectividad y los corredores de menor costo entre las áreas núcleo con 95 % de aKDE utilizando el software Circuitscape y Linkage Mapper a partir de mapas de asociación de hábitat desarrollados utilizando modelos de máxima entropía. Identificamos una red de 83 corredores potenciales que conectan 43 áreas núcleo; los corredores variaron de <1 a 165 km de longitud. Encontramos dos áreas distintas en el rango del borrego cimarrón del desierto en Sonora: un área sur caracterizada por una alta conectividad con corredores más cortos de menor resistencia a los movimientos, y un área norte caracterizada por una conectividad mucho menor con corredores más largos de mayor resistencia; la conectividad entre estas dos áreas fue limitada. Estos resultados ilustran la distribución aislada de muchas poblaciones de borrego cimarrón del desierto y la conectividad limitada entre las poblaciones del norte y sur de Sonora. Nuestros mapas de conectividad proporcionan una base para orientar las acciones de gestión destinadas a facilitar el movimiento y la expansión de las poblaciones de borrego cimarrón del desierto en Sonora. En consecuencia, pueden orientar los esfuerzos de conservación que identifican y promueven la preservación de parches o corredores clave; facilitan la restauración del hábitat dentro y alrededor de los corredores; y mejoran la conectividad y, por lo tanto, la viabilidad de las poblaciones en todo Sonora.
Keywords: Biological corridors; connectivity; circuit theory; desert bighorn; least-cost path; Sonora.
© 2024 Asociación Mexicana de Mastozoología, www.mastozoologiamexicana.org
Introduction
Bighorn sheep (Ovis canadensis mexicana) historically occupied three main areas of México: 1) Vizcaíno Desert and Mechudo mountains on the Baja California peninsula 2) from northern Sonora to northern Baja California, and 3) from northern Chihuahua to northern Coahuila (Ceballos and Oliva 2005; Medellín et al. 2005; Romero-Figueroa et al. 2024). However, anthropogenic impacts such as unregulated hunting, habitat loss and modification, overgrazing by livestock, diseases from domestic animals, and loss of water sources have resulted in the extirpation of some local populations, while the remaining populations are highly fragmented and have low population sizes (Sandoval 1985; Smith and Krausman 1988; Ceballos and Oliva 2005; Romero-Figueroa et al. 2024). Currently, the populations in Sonora and the Baja California peninsula are considered stable (Lee 2003; Romero-Figueroa et al. 2024), while other populations are maintained under semi-captivity in the states of Chihuahua and Coahuila (Sánchez 2005; Uranga and Valdez 2011). However, due to the increased extinction risks from population fragmentation caused by human activities, which impacts demographic stability through deterministic and stochastic effects, bighorn sheep are under Special Protection in México (NOM-059-SEMARNAT-2010; DOF 2010).
Like other large herbivores, bighorn sheep are more vulnerable to population collapse and face a higher risk of extinction than smaller-bodied species (Bowyer et al. 2019). Local populations of bighorn face many potential threats to their persistence associated with habitat modifications (i. e., urbanization, highway development, and agricultural development) (Monson and Sumner 1980; Smith and Krausman 1988). In particular, land use changes can fragment previously contiguous habitats, resulting in smaller suitable patches scattered throughout the landscape (Lindermayer 2019). Fragmentation into smaller habitat patches occupied by small remanent populations increases extirpation risks because of demographic issues and vulnerability to stochastic environmental effects, both of which increase likelihood of local extinction and inbreeding (Bleich et al. 1996; McCullough 1996).
Increasing human impacts and resultant habitat fragmentation makes conservation and recovery of desert bighorn (Ovis canadensis mexicana) in Sonora challenging. Maintaining habitat connectivity is an important strategy for mitigating the detrimental effects of fragmentation on populations (Anděl et al. 2010); hence, there is growing recognition of the need to prioritize management of habitat patches and corridors at the landscape level in México, driven particularly by concern for endangered species (e. g., Ceballos et al. 2021; González-Saucedo et al. 2021; Balbuena-Serrano et al. 2022; Torres-Romero et al. 2023). Such concerns similarly apply to large herbivores that occur in small isolated populations or metapopulations (McCullough 1996). Identifying potential movement corridors for bighorn may be particularly important in arid environments such as Sonora, where populations lack large contiguous habitats as in more northern temperate environments. Instead, desert bighorn are naturally isolated in smaller habitat patches associated with isolated mountain ranges or other rocky habitats (Bleich et al. 1990; Bleich et al. 1996).
Connectivity among habitat patches is dependent on landscape attributes that facilitate or impede movement between patches (Taylor et al. 1993). Higher-quality habitats with suitable landscape connectivity can increase the likelihood of species persistence and population viability in response to landscape alterations (Vasudev et al. 2015). Individuals move more readily through suitable habitats during dispersal or exploratory movements; in contrast, a landscape with less suitable habitat decreases the connectivity among patches (Keeley et al. 2017). Identifying core habitats with high permeability of movements between these areas (i. e., existence of suitable connectivity corridors) would therefore enhance conservation of bighorn in México, including identifying areas suitable for population expansion and restorations, which is a current focus of desert bighorn management in Sonora and throughout México.
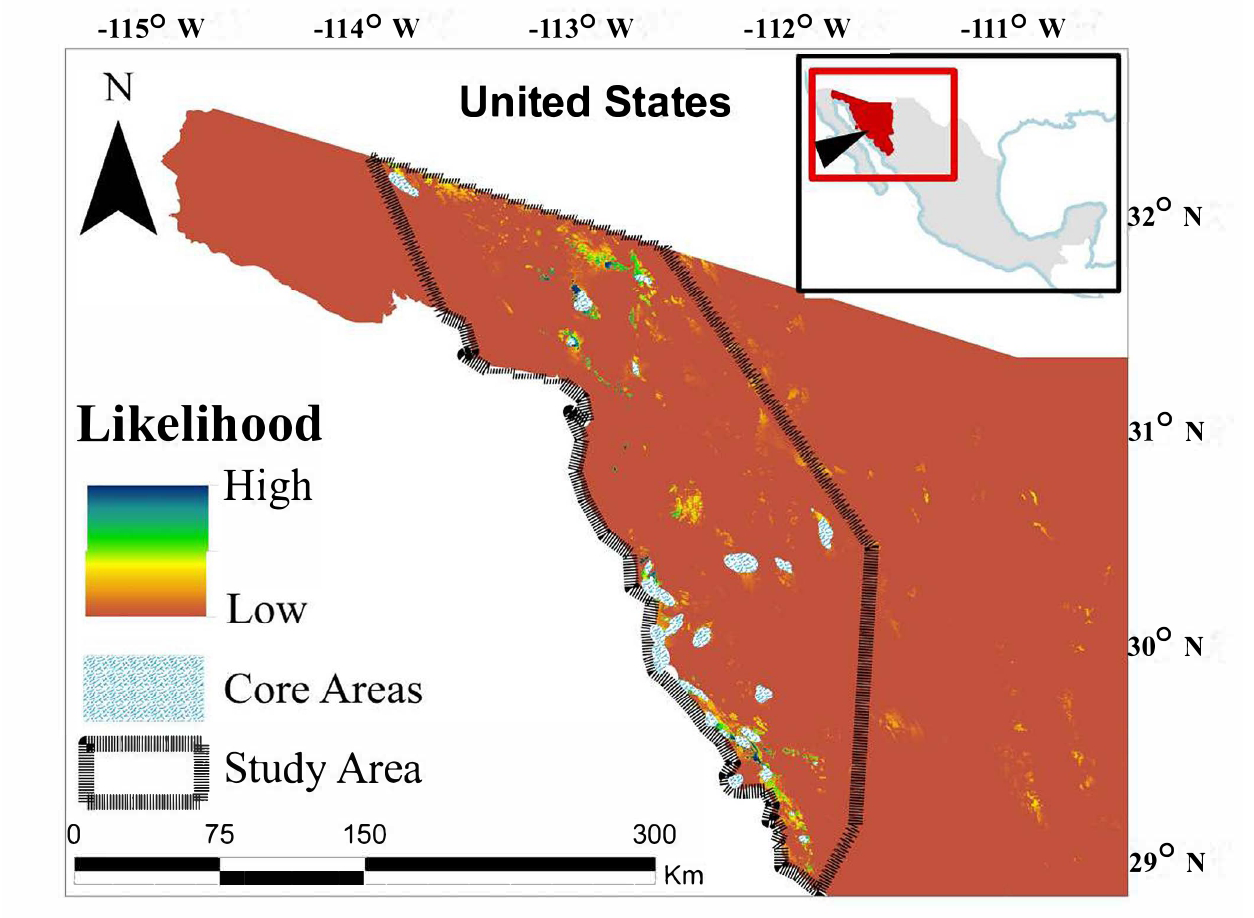
Because desert bighorn are highly valued for their ecological (Monson and Sumner 1980) and economic contributions (Lee 2011), comprehensive and adaptive conservation strategies driven by reliable information that address the needs and interests of managers and other stakeholders are needed in Mexico (Ortega-Argueta et al. 2016). To address this need for the fragmented populations of desert bighorn in Sonora, our goal was to define locally, individually-based habitat associations of desert bighorn, and use these to model connectivity of the Sonoran landscape for desert bighorn. Our specific objectives included: 1) identify core habitats of extant desert bighorn populations, 2) Construct a habitat likelihood map for desert bighorn to evaluate landscape permeability, and 3) Model functional connectivity and corridors that could facilitate movements of desert bighorn among populations in Sonora.
Materials and methods
Study area. The region is characterized by the Sonora Mountains, which comprise four distinct physiographic provinces: Sierra Madre Occidental, Sierras and Paralelos Valleys at its center, desert, and coastal areas along the Gulf of California (Figure 1). The climate is dry and temperate; precipitation averages 450 mm annually, with most occurring in July (> 86 mm) and the least in May (< 3.2 mm; INEGI 2010). Elevations range from 0 to 2,625 m. General vegetation includes primarily grassland and rosetophyllous scrub (INEGI 2017).
Desert bighorn are primarily found in northwest Sonora, adjacent to the Gulf of California, including six municipalities: Hermosillo, Pitiquito, Caborca, Puerto Peñasco, Plutarco Elías Calles, and San Luis Río Colorado. Desert bighorn occur in mountainous areas characterized by deep valleys and narrow passageways, including the Sierra of Posada, Noche Buena, and the Sierra del Viejo (Valverde 1976; Segundo-Galan 2010).
Habitat association and radio-collared desert bighorn data. We used a database of satellite telemetry locations from 30 adult female and nine adult male desert bighorn obtained from the Program for the conservation, repopulation, and sustainable use of bighorn sheep in the state of Sonora (hereafter, the Sonora Bighorn Program), collected April 2019 to October 2022 following capture in March 2019. Desert bighorn were captured throughout extant desert bighorn habitat in Sonora (Figure 1) by aerial netgunning from a Robinson R-44 helicopter (Robinson Helicopter Company, Torrance, CA) and fitted with a global positioning system (GPS)/satellite radio-collar (TELENAX, El Marques, Querétaro, México) programmed to record one location per day. Following processing, each desert bighorn was released at the capture location. Radio-collared desert bighorn were distributed throughout current desert bighorn distribution in Sonora.
Telemetry data included 24,164 locations from April 2019 through October 2022. We plotted locations in ArcMap 10.5 (Environmental Systems Research Institute, Inc, Redlands, CA), using only 3D fixes because these had an accuracy of <10 m (TELENAX, El Marques, Querétaro, Mexico). Because our short term (i. e., daily) locations were not spatially independent (i. e., they were autocorrelated), we calculated 95 % autocorrelated kernel utilization distributions (aKDEs) from locations to define annual home ranges using continuous-time movement modeling (Fleming et al. 2014, 2016) in ctmmweb (https://ctmm.shinyapps.io/ctmmweb/; Calabrese et al. 2016, 2021). We then used resultant 95 % aKDEs as core areas or nodes to map connectivity among these patches in Sonora (Rayfield et al. 2011).
We calculated a composite 100 % minimum convex polygon (MCP) from all locations pooled in ArcMap and added a five km buffer (which corresponded to the mean distance we observed desert bighorn moving between separate rocky ranges in Sonora) to define the overall bighorn use area (i. e., habitat availability). We used the combined 100 % buffered MCP to characterize the study area in terms of habitat attributes available to bighorn. We used 10 habitat variables for assessing habitat associations of desert bighorn, derived from 90 m resolution rasters (Table 1). We selected habitat variables that have previously been related to distribution and habitat use of bighorn and other large herbivores in arid environments in México and the southwestern USA (e. g., Monson and Sumner 1980; Andrew et al. 1999; Krausman and Shackleton 2000; Álvarez–Cárdenas et al. 2001; Guerrero-Cardenas et al. 2003; Bangs et al. 2005; Medellín et al. 2005; Ruiz-Mondragón et al. 2018; Bender et al. 2022; Bender et al. 2023; Whiting et al. 2023). We delineated habitat types from land cover mapping by the National Institute of Statistic and Geographic (https://www.inegi.org.mx; series VI, 1:250,000, INEGI 2017). We used three habitat types for analyses based on proportions within bighorn ranges; sarcocaule shrubland (matorral sarcocaule; 79 % of home ranges), microphyll scrub (matorral desertico microfilo; 19 % of home ranges), and all others (<2 % of home ranges) pooled. We determined distance to rivers/lakes, water bodies, roads, and human settlements using the Euclidean distance metric in ArcGIS (Tédonzong et al. 2020). We determined slope and aspect from 90 m resolution digital elevation models (DEMs; INEGI 2020) in ArcGIS and terrain ruggedness (Riley et al. 1999) in QGIS (Table 1; QGIS 2015).
We used maximum entropy modeling (MaxEnt 3.4.1; Phillips et al. 2006) to model likelihood of desert bighorn presence in Sonora. Maximum entropy is a machine learning response that starts with known locations and compares habitat correlates at those sites to these same correlates at 10,000 random points throughout the study site. The maximum entropy algorithm is deterministic and will converge to the maximum entropy probability distribution (Phillips et al. 2006). The model results in a non-negative value assigned to each pixel, with values ranging from 0.0 to 1.0 to indicate the likelihood of a site being used by desert bighorn. Importantly, maximum entropy modeling relates presence locations to random locations and not to inferred absences; because this approach utilizes only known locations, it eliminates the need for absence data which are invariably unknown.
We assessed models using receiver operating characteristic (ROC) plots (Phillips et al. 2006). The ROC is a plot of sensitivity and 1 – specificity, with sensitivity representing how well the data correctly predicts presence while specificity provides a measure of correctly predicted absences (Fielding and Bell 1997). We then used the area under the ROC curve (AUC) to assess performance of models (Fielding and Bell 1997; Phillips et al. 2006). This approach provides an index of model accuracy; values range from 0.5 to 1.0, with values of 0.5 indicating no fit greater than that expected by chance. Standard errors were calculated for AUC values using 30 % of locations as test data (Phillips et al. 2006).
We constructed separate models for each individual desert bighorn for which annual data were available (n = 43) using the habitat variables above. We used the individual as the replicate to incorporate individual variation into the final model of desert bighorn habitat likelihood (Baldwin 2009). For model development, we used the complementary log‐log (clog-log) transformation and automatic features selection with cross-validation to reduce overfitting (Elith et al. 2011; Phillips and Dudík 2008). We used 70 % of locations for model training data and the remaining 30 % for model testing (Zurell et al. 2020; Phillips et al. 2006). We first modeled all variables individually to ensure that each provided useful information on distribution of desert bighorn (i. e., variables AUC had a lower 95% CI of >0.50; Swets 1988). We then constructed fully parameterized models for each desert bighorn because we wanted to produce the most generalized model of desert bighorn likelihood possible (rather than identifying individual variables most associated with desert bighorn presence), analogous to minimizing bias in an information-theoretic approach (i. e., drawing the most life-like elephant; Wel 1975; Burnham and Anderson 1998). Last, we averaged the resultant maps of likelihood of landscape presence from each individual desert bighorn to create a mean likelihood coverage in ArcGIS. We used this mean likelihood map as the habitat association model (HAM) for modeling corridors (Cushman et al. 2006).
Resistance surface layer and connectivity analysis. We calculated a resistance surface layer (R) with values ranging from 1 (least resistance to movements) to 100 (greatest resistance to movements) based on the inverse of the HAM, where R = 100 – (100 × HAM). The resistance layer illustrates the difficulty of, or resistance to, desert bighorn movement within any given location in the landscape (Mateo-Sánchez et al. 2014; Khosravi et al. 2022). We then used Circuitscape V 4.0 (McRae et al. 2013), which uses circuit theory to model population connectivity as analogous to an electrical current (McRae et al. 2008), to generate a connectivity model among core areas (i. e., 95 % aKDE ranges). This process uses a graph-theoretical approach to predict movement patterns and quantify the effects of landscape features that impede species movement (Cushman et al. 2013).
We further identified optimal connectivity corridors using the least-cost paths approach (Adriaensen et al. 2003; Balbi et al. 2019). Least-cost paths are the routes between two nodes (i. e., core areas) that minimize accumulated resistance across all pixels intersecting the routes. To determine least-cost paths, we utilized the Linkage Mapper 3.0.0 extension for ArcMap (McRae and Kavanagh 2011), which calculates all possible routes in the landscape and their costs, with the lowest cost routes identified using the Cost Distance algorithm. This algorithm calculates the minimum accumulated cost distance between two nodes; the result is a vector layer of lines (routes) that establish the optimal routes for the establishment of corridors (Adriaensen et al. 2003). We then determined cost-weighted distances (CWD) between core areas (i. e., individual desert bighorn 95 % aKDEs) and classed CWD into five categories (low, medium, high, very high, and highest) for presentation and analysis of least-cost paths. Last, we used ANOVA (Zar 1999) to test for differences in likelihood of desert bighorn presence and length of corridors among classes of corridors.
Results
The OUF‐anisotropic continuous time movement model (ctmm) either provided the best fit (85 % of models) or was within AUCc < 2 of the best fit model (15 % of models; size of home ranges did not differ from the lowest AUCc model in these cases) for all desert bighorn. Consequently, we used OUF‐anisotropic models for all 95 % aKDE home ranges. The OUF-anisotropic movement model is the most general of ctmms, and includes a home range, correlated locations, correlated velocities, and movements varying by direction (Fleming et al. 2014, 2016; Calabrese et al. 2021). Annual home range sizes averaged 19.8 (SE = 4.0) km2 for females and 30.7 (SE = 5.1) km2 for males. From individual movement data, we observed a minimum of 6 dispersal or seasonal movements of desert bighorn among disjunct ranges or rocky islands that were separated by a range of 2 to 8 km (mean = 5.0; SE = 1.0).
Individual desert bighorn maximum entropy models showed extremely high fit (mean = 0.991; SE = 0.001; range = 0.977 to 0.998 [SE range 0.010 to 0.050]). The mean habitat association likelihood map revealed a landscape of scattered small high-quality patches in the human-dominated matrix of Sonora (Figure 1). Resistance to movements characterized two distinct areas of flow within our study area: an extensive patch dominating the southern area with relatively high permeability and a smaller patch with lower permeability in the northern area (Figure 2). Between these two areas was a large region of low permeability to movements (Figure 2). Similarly, within the northern area was a large region of very low permeability between the northernmost and southernmost core areas.
We identified a network of 83 potential corridors spanning 4,276 km that interconnected 43 desert bighorn core areas throughout northeast Sonora (Table 2; Figure 3). The northern portion of our area was the most isolated, with only 19 potential links (including four that connected the northern and southern areas), while the southern area contained 64. Among these, 14 corridors measured < 1 km and were predominantly located in the southern region. A total of 20 corridors spanned a distance of < 10 km, and 42 corridors were < 20 km. A total of eight corridors were > 100 km, and occurred solely in the northern area or between the northern and southern areas (Figure 3).
Mean likelihood of desert bighorn presence declined (F2,80 = 60.6; P < 0.001) as resistance to movements increased from low resistance (likelihood = 0.44) to moderate (likelihood = 0.25) to high (likelihood = 0.09). Similarly, classes of potential corridors with lower resistance to movement were shorter (F2,80 = 33.7; P < 0.001) than higher resistance classes (Table 2).
Discussion
Our evaluation of landscape resistance to desert bighorn movements and potential movement corridors identified two distinct areas within current desert bighorn range in Sonora: a northern and a southern area, with low and high connectivity, respectively, and with limited potential connectivity between these areas (Figures 2 and 3). Both of these areas are considered important regions for desert bighorn conservation in Sonora, and thus require attention regarding facilitating the movement of desert bighorn within and between areas, as well as between the northern area and bighorn populations in adjacent northern Baja California (e. g., Ruiz-Mondragon et al. 2018). Consequently, our connectivity results can guide conservation efforts that identify and promote preservation of key patches or corridors; facilitate habitat restorations within and around corridors; and thus enhance connectivity and viability of populations in both areas of Sonora (Shepherd and Whittington 2006; Castilho et al. 2015; Dutta et al. 2016; Allen et al. 2016).
We found the southern area to be characterized by high connectivity among core areas and relatively short potential movement corridors, e. g., 35 % of potential corridors were <10 km in length, which is considered short and indicates easy movement between areas. Additionally, 67 % of the corridors were < 25 km (mean = 19 km), which, while longer, is still within documented movement distances of bighorn in arid environments (Schwartz et al. 1986). Short corridors (under 10 km) are typically easier for individuals to traverse, while longer corridors (over 25 km) may represent more significant barriers or challenges, even to species like desert bighorn which readily move among disjunct habitat patches (Schwartz et al. 1986; Bleich et al. 1990; Bleich et al. 1996).
In the arid Southwestern USA and México, bighorn sheep regularly move between isolated desert mountain ranges or clusters of rocky habitats (as also observed in this study; Schwartz et al. 1986; Bleich et al. 1990; Bleich et al. 1996). However, the extent of these movements is contingent upon factors such as the distance between sites, sex, and the nature of intervening habitats (Ough and deVos 19864; Bleich et al. 1996; Allen et al. 2016). Individual bighorn in arid environments often move >20 km between ranges (Schwartz et al. 1986). While males are more likely to show exploratory or longer distance dispersal movements than females (Ough and deVos 1984; Bleich et al. 1996), females will also emigrate to neighboring ranges (McQuivey 1978; Bleich et al. 1996). Consequently, the high level of connectivity and numerous core areas in the southern area suggests that this area does not require immediate active management actions to enhance connectivity. Rather, emphasis in southern areas should be on actions that maintain existing conditions, such as careful environmental review of proposed developments, etc., to minimize or mitigate any potential impacts on movements of desert bighorn. The higher habitat quality associated with the shorter low-resistance corridors facilitates movements in the southern area (Ough and deVos 1984).
In contrast, the northern Sonora area is characterized by much lower connectivity, with longer distances among core areas; e. g., only 20 % of potential corridors were < 10 km, 30 % were < 25 km, and potential corridors averaged 41 km in length. Even more challenging for desert bighorn in Sonora is the large separation characterized by significant resistance to movements between northern and southern populations (Figure 2 and 3), where the shortest potential corridor is 107 km and the four potential corridors connecting northern and southern areas averaged 131 km. While female bighorn have occasionally been documented to move >50 km (McQuivey 1978), this level of separation can provide a significant challenge to desert bighorn exchange between northern and southern populations (Ough and deVos 1984; Bleich et al. 1996), as well as within the northern area (although the latter may possibly be somewhat mitigated by movements to or from Baja California populations).
Consequently, the immediate conservation priority for Sonora should be to enhance connectivity within northern Sonora and between the northern and southern Sonora areas. Connections between the northern and southern areas are compromised by factors such greater separation between mountainous terrain, agricultural development, human settlements, primary roads, etc. Hence, the potential corridors we identified between northern and southern areas (and within the northern area) highlight ecologically important areas that should be prioritized for actions to facilitate desert bighorn movements or habitat quality between existing core areas. These actions may include minimizing fences, roads, irrigation canals, and other movement impediments between desert bighorn core areas (NDOW 2001). Management actions in the northern area should ideally be in consort with similar actions in northern Baja California, given the proximity between bighorn sites in these States.
Roads, depending on their type, size, traffic, and other features, are a major cause of mortality and impediments to movement for both small and large mammals in México (González-Gallina and Hidalgo-Mihart 2018; Rubio-Rocha et al. 2022). Hence, new construction or improvements of existing roads should consider including wildlife crossings (i. e., under or over passes) and avoiding continuous guard rails or fences along right-of-ways within potential corridors (NDOW 2001; Manteca-Rodríguez et al. 2021). Because much of desert bighorn range in Sonora is used for livestock grazing, new pasture or right-of-way fencing should follow standard wildlife-friendly recommendations, such as using 99 cm high, three-strand fences with a smooth bottom wire > 51 cm from the ground (NDOW 2001). Such actions can lessen the risk to connectivity between core areas associated with the most common obstructions to desert bighorn movements in Sonora.
Last, we used individual-animal-based habitat data from local desert bighorns to develop inputs to model connectivity among core areas in Sonora. In contrast, most connectivity modelling analyses use expert opinion to identify suitable habitats and barriers to movement, which is vulnerable to several potential biases including lack of local knowledge regarding species habitat use patterns (Dueñas-López et al. 2015). Resource selection or habitat use by wildlife is an adaptive response of individuals to meet their life requirements given existing environmental circumstances (Manly et al. 1993; Bender 2020; Bender et al. 2022). Hence, our methodology of using local desert bighorn to identify habitat attributes associated with their presence offers a more targeted and likely accurate approach for identifying potential movement corridors; local desert bighorn are certainly more aware of what constitutes suitable conditions for themselves than are human experts. While individuals may disperse or move through lower-quality habitats, movements are much more likely through suitable areas (Ough and deVos 1984; Allen et al. 2016) and individuals are much more likely to be successful in movements (i. e., stay alive).
Information on core areas and landscape connectivity can provide very targeted information for conserving bighorn sheep in Mexico, where their distribution is primarily limited to two states (Sonora and the Baja California peninsula) and where the overall population status is considered stable, but the current status of many small isolated populations is unknown (Lee 2003; Romero-Figueroa et al. 2024). Connectivity mapping can be used to strategically place conservation actions such as habitat restorations within or around corridors (Shepherd and Whittington 2006), as well to identify suitable sites for habitat restorations (Bleich et al. 1996). For example, managers should prioritize reestablishing extirpated populations along higher-quality corridors and in proximity to occupied core areas, enhancing the probability of dispersing desert bighorn encountering other populations (Bleich et al. 1996). Minimizing isolation, facilitating movements, and restoring extirpated populations is important to ensure the long-term viability of desert bighorn in Mexico. Because of the ecological and economic importance of desert bighorn, actions that enhance the probability of establishment and connectivity of populations can significantly contribute to the overall welfare of northern México.
Acknowledgments
This project was conducted as part of the program for the conservation, repopulation, and sustainable use of bighorn sheep in the state of Sonora, operating under permits 5,244 and 3,023 issued by the General Directorate of Civil Aeronautics of the Secretaría de Comunicaciones y Transportes and permits issued by the General Directorate of Forestry and Wildlife of the Secretaría de Agricultura, Ganadería, Recursos Hidráulicos, Pesca of Sonora (with trades from 0529/19 to 0534/19). All animal handling and monitoring procedures adhered to the guidelines outlined in the Mexican Official norm NOM-059-DOF-2010). This study was supported by a postdoctoral fellowship from Consejo Nacional de Humanidades, Ciencias y Tecnologías (CONAHCyT -Mexico) to EJT-R. The New Mexico State University Cooperative Extension Service provided additional support for this project. Funding. Funding for this study was provided by private citizens through the Program for the Conservation, Repopulation, as well as the Wild Sheep Foundation, Technical Advisory Council for Wildlife of the State of Sonora, and Sustainable Use of Bighorn Sheep in the State of Sonora. Data availability. Data for this project belongs to the project sponsors and cooperators in Sonora and is not available for general use.
Literature cited
Adriaensen, F., et al. 2003. The application of ‘least-cost’modelling as a functional landscape model. Landscape Urban Planning 64:233–247.
Allen, C. H., L. Parrott, and C. Kyle. 2016. An individual-based modelling approach to estimate landscape connectivity for bighorn sheep (Ovis canadensis). PeerJ 4:e2001.
Alvarez-Cárdenas, S., et al. 2001. The variables of physical habitat selection by the desert bighorn sheep (Ovis canadensis weemsi) in the Sierra del Mechudo, Baja California Sur, Mexico. J ournal of Arid Environments 49:357-374.
Anděl, P., T. Mináriková., and M. Andreas. (eds.). 2010. Protection of Landscape Connectivity for Large Mammals. Evernia, Liberec.
Andrew, N. G., V. C. Bleich., and P. V. August. 1999. Habitat selection by mountain sheep in the Sonoran Desert: implications in the United States and Mexico. California Wildlife Conservation Bulletin 12:1–17.
Baldwin, R. A. 2009. Use of maximum entropy modeling in wildlife research. Entropy 11:854–866.
Balbi, M., et al. 2019. Ecological relevance of least-cost path analysis: An easy implementation method for landscape urban planning. Journal of Environmental Management 244:61–68.
Balbuena-Serrano, Á., et al. 2022. Connectivity of priority areas for the conservation of large carnivores in northern Mexico. Journal for Nature Conservation 65:126116.
Bangs, P. D., et al. 2005. Habitat use by female desert bighorn sheep in the Fra Cristobal Mountains, New Mexico, USA. European Journal of Wildlife Research 51:77–83.
Bender, L. C. 2020. Elk, deer, and pinyon-juniper: needs, what works, and what doesn’t. Pages 34–58, in Symposium proceedings on piñon-juniper habitats: status and management for wildlife - 2016. (Malcolm, K., B. Dykstra, K. Johnson, D. Lightfoot, E. Muldavin, and M. Ramsey, comp.). Proceedings RMRS-P-77. U.S. Forest Service, Rocky Mountain Research Station, Fort Collins, CO, USA.
Bender, L. C., et al. 2022. Resource-area-dependence analysis of desert mule deer Odocoileus hemionus eremicus Cervidae habitats in the San Andres Mountains, New Mexico, USA. Journal of Arid Environments 197:104659.
Bender, L. C., et al. 2023. Resource dependence analysis of home range quality for pronghorn in south-central New Mexico, USA. Journal of Arid Environments 210: Article 104907.
Bleich, V. C., J. D. Wehausen., and S. A. Holl. 1990. Desert-dwelling mountain sheep: conservation implications of a naturally fragmented distribution. Conservation Biology 4:383–390.
Bleich, V. C., et al. 1996. Metapopulation theory and mountain sheep: implications for conservation. Pages 353–373, in Metapopulations and wildlife conservation (McCullough, D. R., ed.). Island Press, Wahington D.C., USA.
Bowyer, R. T., et al. 2019. Conservation of the world’s mammals: status, protected areas, community efforts, and hunting. Journal of Mammalogy 100:923–941.
Burnham, K. P., and D. R. Anderson. 1998. Model selection and inference: a practical information-theoretic approach. Springer New York.
Castilho, C. S., et al. 2015. Evaluating landscape connectivity for Puma concolor and Panthera onca among Atlantic Forest protected areas. Environmental Management 55:1377–1389.
Calabrese, J. M., C. H. Fleming., and E. Gurarie. 2016. ctmm: an R package for analyzing animal relocation data as a continuous‐time stochastic process. Methods in Ecology and Evolution 7:1124–1132.
Calabrese, J. M., et al. 2021. ctmmweb: a graphical user interface for autocorrelation‐informed home range estimation. Wildlife Society Bulletin 45:162–169.
Ceballos, G., and G. Oliva. 2005. Los mamíferos silvestres de México. CONABIO—Fondo de Cultura Económica, Ciudad de México, México.
Ceballos, G., et al. 2021. Jaguar distribution, biological corridors and protected areas in Mexico: from science to public policies. Landscape Ecology 36:3287-3309.
Cushman, S. A., et al. 2006. Gene flow in complex landscapes: testing multiple hypotheses with causal modeling. The American Naturalist 168:486-499.
Cushman, S. A., et al. 2013. Biological corridors and connectivity Pp. 384-404, in Key Topics in Conservation Biology 2 (Macdonald, D. W. and K. J. Willis, eds.). Hoboken, NJ: Wiley- Blackwell, USA.
DOF Diario Oficial de la Federación. 2010. Segunda sección, Secretaría de Medio Ambiente y Recursos Naturales. Noema Oficial Mexicana NOM-059-SEMARNAT-2010, Protección ambiental-Especies nativas de México de flora y fauna silvestres-Categorías de riesgo y especificaciones para su inclusión, exclusión o cambio-Lista de especies en riesgo.
Dueñas-López, G., et al. 2015. Evaluating biological corridors for the jaguar in the Sierra Madre Oriental of eastern Mexico. Therya 6:449-468.
Dutta, T., et al. 2016. Connecting the dots: Mapping habitat connectivity for tigers in central India. Regional Environmental Change 16:53–67.
Elith, J., et al. 2011. A statistical explanation of MaxEnt for ecologists. Diversity and distributions 17: 43-57.
Fielding, A. H., and J. F. Bell. 1997. A review of methods for the assessment of prediction errors in conservation presence/absence models. Environmental conservation 24:38-49.
Fleming, C. H., et al. 2014. From fine‐scale foraging to home ranges: a semivariance approach to identifying movement modes across spatiotemporal scales. American Naturalist 183:E154–E167.
Fleming, C. H., et al. 2016. Estimating where and how animals travel: an optimal framework for path reconstruction from autocorrelated tracking data. Ecology 15‐1607.1.
González-Gallina, A., and M. G. Hidalgo-Mihart. 2018. A Review of Road-killed Felids in Mexico. Therya 9:147–159.
González-Saucedo, Z. Y., A. González-Bernal., and E. Martínez-Meyer. 2021. Identifying priority areas for landscape connectivity for three large carnivores in northwestern Mexico and southwestern United States. Landscape Ecology 36:877-896.
Guerrero-Cardenas, I., I. Tovar., and S. Álvarez. 2003. Factores que afectan la distribución espacial del borrego cimarron Ovis canadensis weemsi en la Sierra del Mechudo, B.C.S., México. Anales del Instituto de Biología. Universidad Nacional Autónoma de México. Serie Zoología 74:83–98.
Instituto Nacional de Estadística y Geografía (INEGI). 2010. Compendio de información geográfica municipal de los Estados Unidos Mexicanos Hermosillo, Sonora clave geoestadística 26030, 11pp.
Instituto Nacional de Estadística y Geografía (INEGI). 2017. Conjunto de datos vectoriales de Uso del Suelo y Vegetación. Serie VI. (Capa Unión). Escala 1: 250 000.
Instituto Nacional de Estadística y Geografía (INEGI). 2020. Modelos Digitales de Elevación de Alta Resolución LiDAR, Terreno ASCII, con resolución de 90m www.inegi.org.mx/.
Keeley, A. T .H., et al. 2017. Habitat suitability is a poor proxy for landscape connectivity during dispersal and mating movements. Landscape and Urban Planning 161:90–102.
Khosravi, R., et al. 2023. Identifying human–brown bear conflict hotspots for prioritizing critical habitat and corridor conservation in southwestern Iran. Animal Conservation 26: 31-45.
Krausman, P. R., and D. M. Shackleton. 2000. Bighorn sheep. Pp. 517–544, in Ecology and management of large mammals in North America (Demarais, S., and P. R. Krauusman, eds). Upper Saddle River, NJ: Prentice Hall..
Lee, R. 2003. A 10-year view of wild sheep management in Sonora, Mexico. Desert Bighorn Council Transactions 47:43–46.
Lee, R. 2011. Economic aspects of and the market for desert bighorn sheep. Desert Bighorn Council Transactions 51:46-49.
Lindenmayer, D. 2019. Small patches make critical contributions to biodiversity conservation. Proceedings of the National Academy of Sciences of the United States of America 116:717–719.
Manly, B. F. J., et al. 2002. Resource selection by animals: statistical design and analysis for field studies. New York, NY: Klumer Academic Publishers.
Manteca-Rodríguez, M., et al. 2021. Wildlife use of drainage structures under 2 sections of Federal Highway 2 in the Sky Island Region of Northeastern Sonora, Mexico. Air, Soil and Water Research 14.
McCullough, D. R. 1996. Metapopulations and wildlife conservation. Island Press, Wahington D. C., USA.
McQuivey, R. P. 1978. The Bighorn Sheep of Nevada. Biological Bulletin No. 6. Nevada Department of Wildlife. Reno, NV. McRae, B., and D. Kavanagh. 2011. Linkage Mapper Connectivity Analysis Software, Seattle, Washington, USA.
McRae, B. H., et al. 2008. Using circuit theory to model connectivity in ecology, evolution, and conservation. Ecology 89:2712–2724.
McRae, B. H., et al. 2013. Circuitscape 4. Seattle WA: The Nature Conservancy.
Mateo-Sanchez, M. C., S. A. Cushman., and S. Saura. 2014. Connecting endangered brown bear subpopulations in the Cantabrian Range (north-western Spain). Animal Conservation 17:430–440.
Medellín, R. A., et al. 2005. History, ecology, and conservation of the pronghorn antelope, bighorn sheep, and black bear in Mexico. Pp. 387–404, in Biodiversity, ecosystems, and conservation in northern Mexico (Cartron, J. L., G. Ceballos, and R. S. Felger, eds.). Oxford University Press, Oxford, United Kingdom.
Monson, G., and L. Sumner. (eds). 1980. The desert bighorn, its life history, ecology and management. The University of Arizona Press. Tucson, U. S. A.
NDOW. 2001. Bighorn Sheep Management Plan. Nevada Division of Wildlife, Reno, NV, USA.
Ortega-Argueta, A., A. González-Zamora., and A. Contreras-Hernández. 2016. A framework and indicators for evaluating policies for conservation and development: The case of wildlife management units in Mexico. Environmental Science & Policy 63:91-100.
Ough, W. D., and J. C. deVos, Jr. 1984. Intermountain travel corridors and their management implications for bighorn sheep. Desert Bighorn Council Transactions 28:32–36.
Phillips, S. J., R. P. Anderson, and R. E. Schapire. 2006. Maximum entropy modeling of species geographic distributions. Ecological Modelling 190:231–259.
Phillips, S. J., and M. Dudik. 2008. Modeling of species distributions with Maxent: new extensions and a comprehensive evaluation. Ecography 31:161–175.
QGIS. 2015. QGIS Geographic Information System. QGIS Association. http://www.qgis.org.
Rayfield, B., M. J. Fortin., and A. Fall. 2011. Connectivity for conservation: a framework to classify network measures. Ecology 92:847-858.
Riley, S. J., S. D. De Gloria., and R. Elliot. 1999. A terrain ruggedness index that quantifies topographic heterogeneity. Intermountain Journal of Science 5:23–27.
Romero-Figueroa, G., et al. 2024. Population and Conservation Status of Bighorn Sheep in the State of Baja California, Mexico. Animals 14:504.
Ruiz-Mondragón, E. D .J., et al. 2018. Potential distribution model of Ovis canadensis in northern Baja California, Mexico. Therya 9:219-226.
Rubio-Rocha, Y., et al. 2022. First records of road-killed mammals in the state of Sinaloa, México. Therya Notes 3:53-58.
Sandoval, A. V. 1985. Status of bighorn sheep in the Republic of Mexico. Pp. 86–94, in Wild sheep: distribution, abundance, management and conservation of the wild sheep of the world and closely related mountain ungulates (M. Hoefs, ed.). Northern Wild Sheep and Goat Council Special Report, Yukon, Canada.
Sánchez, O. 2005. Ovis canadensis Shaw, 1804. Pp. 507-509, in Los Mamíferos Silvestres de México (Ceballos, G., and G. Oliva, eds.). Fondo de Cultura Económica. Distrito Federal, México.
Segundo-Galán, J. 2010. Borrego cimarrón (Ovis canadensis mexicana): Resultados del monitoreo aéreo en el Estado de Sonora, México. Noviembre-Diciembre, 2009. Dirección General Forestal y de Fauna de Interés Cinegético de la Sagarhpa, Sonora. México.
Schwartz, O. A., V. C. Bleich., and S. A. Holl. 1986. Genetics and the conservation of mountain sheep Ovis canadensis nelsoni. Biological Conservation 37:179–190.
Shepherd, B., and J. Whittington. 2006. Response of wolves to corridor restoration and human use management. Ecology and Society 11:2.
Smith, N., and P. Krausman. 1988. Desert bighorn sheep: a guide to select management practices. Biological Report 88(35). U.S. Fish and Wildlife Service, United States Department of the Interior, Washington D.C.
Swets, J. A. 1988. Measuring the accuracy of diagnostic systems. Science 240:1285–1293.
Taylor, P. D., et al. 1993. Connectivity is a vital element of landscape structure. Oikos 68:571–3.
Tédonzong, L. R. D., et al. 2020. Variation in behavioral traits of two frugivorous mammals may lead to differential responses to human disturbance. Ecology and Evolution 10:3798–3813.
Torres-Romero, E. J., et al. 2023. Jaguar conservation in the American continent: the role of protected landscape and human-impacted biomes. Revista de Biología Tropical, 71:1.
Uranga, T., and R. Valdez. 2011. Reintroduction of desert bighorn sheep in Chihuahua, Mexico. Desert Bighorn Council Transaction 51:32-38.
Vasudev, D., et al. 2015. From dispersal constraints to landscape connectivity: lessons from species distribution modeling. Ecography 38:967–78.
Valverde, J. M. 1976. The bighorn sheep of the state of Sonora. Desert Bighorn Council Transactions 20:25-26.
Wel, J. 1975. Least squares fitting of an elephant. Chemtech Feb. 128–129.
Whiting, J. C., et al. 2023. Restoration of bighorn sheep: history, successes, and remaining conservation issues. Frontiers in Ecology and Evolution 11:1083350.
Zar, J. H. 1999. Biostatistical analysis. Upper Saddle River, NJ: Prentice Hall.
Zurell, D., et al. 2020. Testing species assemblage predictions from stacked and joint species distribution models. Journal of Biogeography 47:101-113.
Associated editor: Rafael Reyna
Submitted: May 13, 2024; Reviewed: June 13, 2024
Accepted: August 28, 2024; Published on line: September 16, 2024
Figure 1. Mean likelihood of presence for desert bighorn (Ovis canadensis mexicana) in northwest Sonora, México.
Table 1. Classes, variables, and sources used to model habitats for bighorn sheep in the northeast of Sonora.
|
Class |
Variables |
Source |
|
Topographic |
Elevation (DEMs) |
INEGI 2020 |
|
Slope |
INEGI 2020 |
|
|
Aspect |
INEGI 2020 |
|
|
Terrain Ruggedness Index (TRI) |
Riley et al. 1999 |
|
|
Human impact |
Distance to settlements |
INEGI 2017 |
|
Distance to roads |
INEGI 2017 |
|
|
Land cover |
Tree cover |
Hansen et al. 2013 |
|
Vegetation types |
INEGI 2017 |
|
|
Water resources |
Distance to rivers |
INEGI 2017 |
|
Distance to water bodies |
INEGI 2017 |
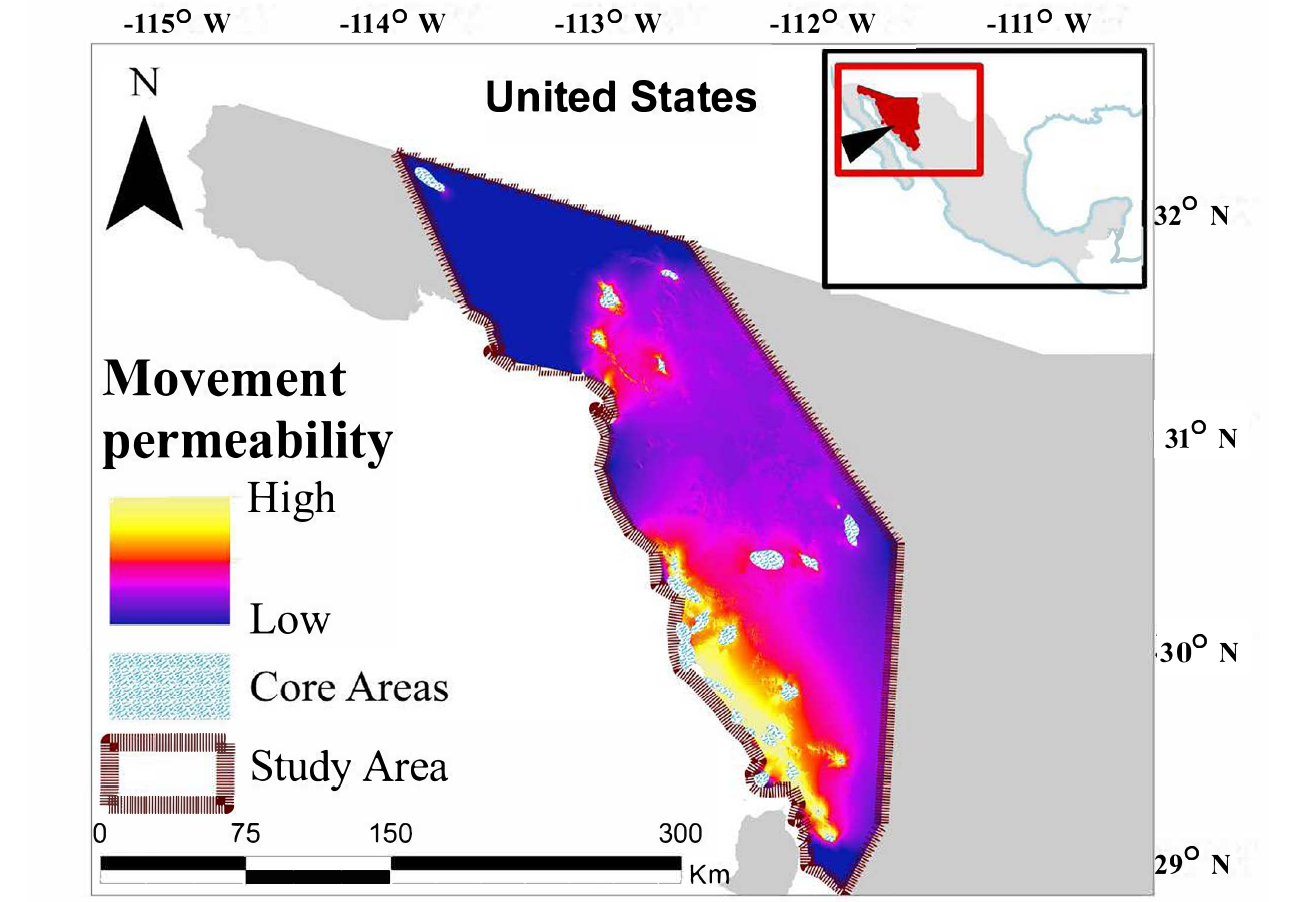
Figure 2. Estimated permeability of the northwest Sonora landscape to movements by desert bighorn (Ovis canadensis mexicana).
Table 2. Classes of modeled corridors based on resistance to desert bighorn movements, Sonora, Mexico. Characteristics of each class presented include likelihood of desert bighorn presence (Likelihood), total length of corridors, and mean length of corridors. Also presented is the High Class subdivided into 3 subclasses (High, Very High, and Highest).
|
Resistance |
Likelihood |
Length |
|||||
|
Class |
Subclass |
Mean |
SE |
Total |
Mean |
SE |
N |
|
Low |
0.44 A |
0.03 |
66.2 |
2.5 A |
0.6 |
26 |
|
|
Moderate |
0.25 B |
0.04 |
351.3 |
17.6 B |
0.9 |
20 |
|
|
High |
0.09 C |
0.02 |
1924.4 |
52.1 C |
6.1 |
37 |
|
|
High |
0.09 |
0.02 |
527.6 |
29.3 |
0.9 |
18 |
|
|
Very High |
0.06 |
0.02 |
548.4 |
45.7 |
2.5 |
12 |
|
|
Highest |
0.09 |
0.03 |
853.4 |
121.9 |
7.8 |
7 |
|
ABC = Means with different letter differ by Class (P < 0.003).
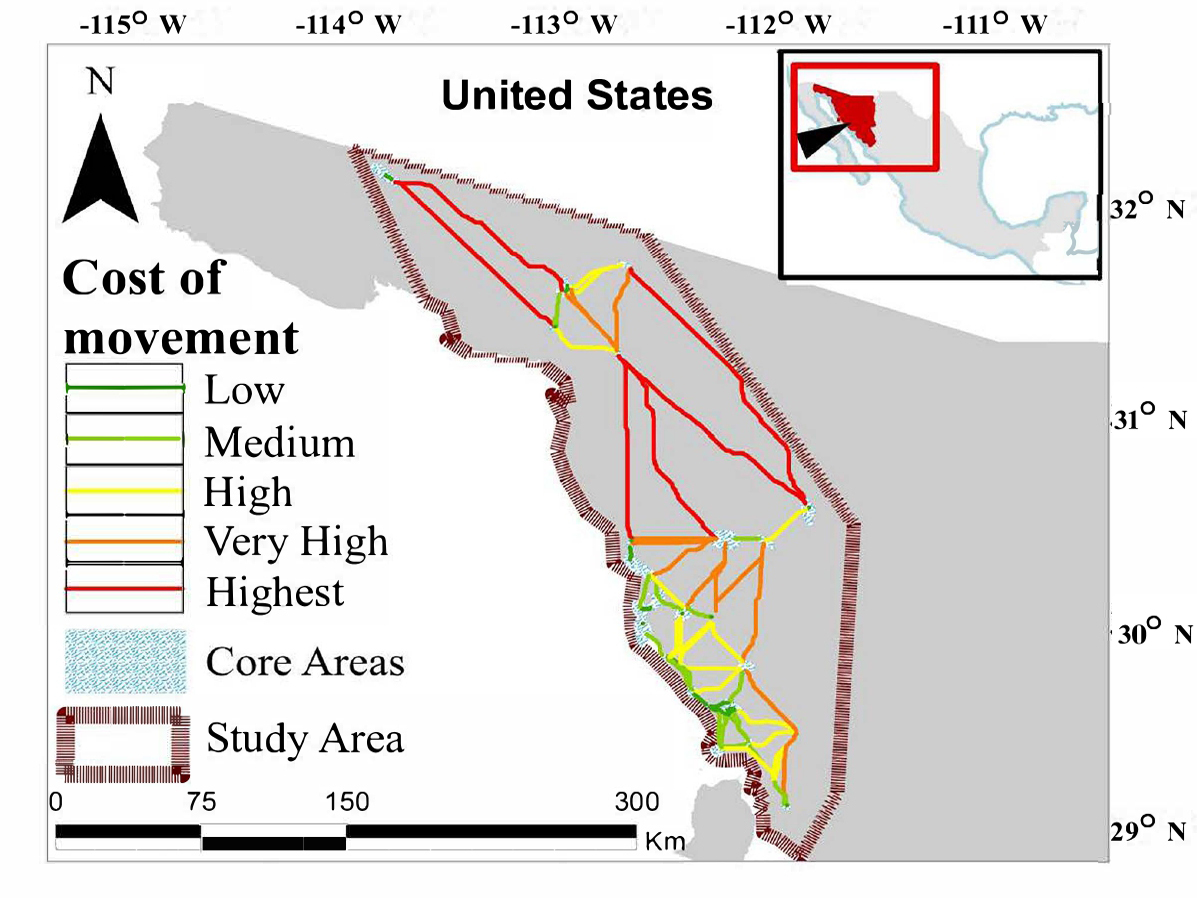
Figure 3. Location and quality of potential linkages between desert bighorn (Ovis canadensis mexicana) core areas in northwest Sonora, México. Linkage quality is determined from the ratio of cost-weighted distance to least-cost paths. Higher values indicate higher cost of movement along the path of least resistance and lower values indicate lower costs of movements along the least-cost path.