THERYA, 2025, Vol. 16(1):143-161 DOI:10.12933/therya-25-6173 ISSN 2007-3364
Influence of late Holocene climate and wildfire on mammalian community composition in the northern Rocky Mountains (USA)
M. Allison Stegner1* and Elizabeth A. Hadly1, 2
1 Department of Biology. Stanford University, 371 Jane Stanford Way, 94305-5020, Stanford, California, USA. E-mail: astegner@stanford.edu; (MAS; Current address: Southwestern Biological Science Center, U.S. Geological Survey. Email: mstegner@usgs.gov).
2Department of Earth Systems Science. Stanford University, 473 Via Ortega, 94305-5020, Stanford, California, USA. Email: hadly@stanford.edu (EAH).
* Corresponding author: https://orcid.org/0000-0002-1412-8203.
Over the last half century, the Rocky Mountains have experienced increasing temperatures, more frequent droughts, and remarkable increases in wildfire: trends that are expected to continue. While the consequences of ongoing climate and fire regime change for this region are uncertain, previous research suggests that the combination of more frequent fire with changing climate may lead to abrupt changes in vegetation, causing downstream effects including altering mammal communities. Small mammals, in particular, are more habitat-specific and less able to move great distances in response to habitat disturbance. Reconstructing how these ecosystems have responded to climate and fire regime change in the past can reveal underlying dynamics that enable us to anticipate how they will react to future changes. Although there has been substantial research on fire-climate-vegetation relationships, the long-term impacts of fire on small mammal communities are not well characterized. Here, we use mammalian fossils from Waterfall Locality, a fossil packrat midden in northeastern Yellowstone National Park spanning ~3,400 to 250 calendar years before present (cal YBP), to reconstruct mammal diversity (species richness, evenness, and relative abundance) through time and to explore whether changes in diversity and community composition were related to climate and fire regime. We evaluate reconstructed wildfire activity from sedimentary charcoal as well as seven modeled climate variables (mean annual temperature, minimum winter temperature, maximum summer temperature, temperature seasonality, mean annual precipitation, mean summer precipitation, and precipitation seasonality). We find evidence that both summer precipitation and wildfire contributed to small mammal community turnover. Higher summer precipitation was associated with higher proportions of closed-habitat mammals and lower proportions of open habitat mammals. Elevated levels of wildfire activity near the site from ~2,200 – 1,800 cal YBP likely also contributed to this change in closed- versus open-habitat mammals around 1,600 cal YBP. Waterfall Locality represents a ~3,400-year record of mammal diversity in lower montane forests of the northern Rockies, analyses of which provide context for predicting future changes to the mammal community in this region.
Durante el último medio siglo, las Montañas Rocosas han experimentado temperaturas crecientes, sequías más frecuentes y aumentos notables de incendios forestales: tendencias que se espera que continúen. Si bien las consecuencias del actual cambio climático y del régimen de incendios para esta región son inciertas, investigaciones anteriores sugieren que la combinación de incendios más frecuentes con un clima cambiante puede provocar cambios abruptos en la vegetación, causando efectos aguas abajo, incluida la alteración de las comunidades de mamíferos. Los mamíferos pequeños, en particular, son más específicos de su hábitat y menos capaces de moverse grandes distancias en respuesta a la alteración del hábitat. Reconstruir cómo estos ecosistemas han respondido al cambio climático y al cambio del régimen de incendios en el pasado puede revelar dinámicas subyacentes que nos permitan anticipar cómo reaccionarán ante cambios futuros. Aunque se han realizado importantes investigaciones sobre las relaciones entre el fuego, el clima y la vegetación, los impactos a largo plazo del fuego en las comunidades de pequeños mamíferos no están bien caracterizados. Aquí, utilizamos fósiles de mamíferos de Waterfall Locality, un basurero de ratas fósiles en el noreste del Parque Nacional de Yellowstone que abarca aproximadamente 3400 a 250 años calendario antes del presente (cal YBP), para reconstruir la diversidad de mamíferos (riqueza de especies, uniformidad y abundancia relativa) a través de tiempo y explorar si los cambios en la diversidad y la composición de la comunidad estaban relacionados con el clima y el régimen de incendios. Evaluamos siete variables climáticas modeladas (temperatura media anual, temperatura mínima en invierno, temperatura máxima en verano, estacionalidad de la temperatura, precipitación media anual, precipitación media en verano y estacionalidad de la precipitación), así como la actividad de incendios forestales reconstruida a partir de carbón sedimentario. Encontramos evidencia de que tanto las precipitaciones de verano como los incendios forestales contribuyeron al recambio de las comunidades de pequeños mamíferos. Las mayores precipitaciones de verano se asociaron con mayores proporciones de mamíferos de ambientes cerrados y proporciones más bajas de mamíferos de ambientes abiertos. Los niveles elevados de actividad de incendios forestales cerca del sitio de ~2200 a 1800 cal YBP probablemente también contribuyeron a esto en mamíferos de ambiente cerrado versus abierto alrededor de 1600 cal YBP. La localidad de Waterfall representa un registro de ~3400 años de diversidad de mamíferos en los bosques montanos bajos del norte de las Montañas Rocosas y proporciona un contexto para cambios futuros en la comunidad de mamíferos en esta región.
Keywords: Holocene; northern Rocky Mountains; packrats; small mammals; vegetation change; wildfire; Yellowstone National Park.
© 2025 Asociación Mexicana de Mastozoología, www.mastozoologiamexicana.org
Introduction
The climate of the northern Rocky Mountains is projected to exceed historical ranges of variability within this century (Meehl et al. 2007), leading to increases in fire frequency (Westerling et al. 2011) with unclear ramifications for Rocky Mountain forested ecosystems. Wildfires in the northern Rockies increased 889 % in frequency and 2,966 % in area burned from 1973 to 1983 and 2003 to 2012 (Westerling 2016). Wildfire activity is strongly tied to climate in western North America: increased fire risk is correlated with higher spring and summer temperatures and earlier snowmelt (Westerling et al. 2006). Reconstructing how these ecosystems have responded to climate change and increased fire in the past can reveal underlying dynamics that enable us to anticipate how they will react to future changes.
Forests of the northern Rockies are adapted to recurrent stand-replacing wildfires on the scale of centuries to millennia, but changes in fire frequency and severity in combination with changing temperature and/or precipitation can lead to abrupt shifts in vegetation composition (Sánchez Goñi 2017; Hansen et al. 2018; Hansen and Turner 2019). Globally, recent fires paired with rising temperatures have already caused abrupt vegetation changes in montane, subalpine, and boreal conifer forests (Johnstone and Chapin 2003; Wirth et al. 2008; Johnstone et al. 2010; Savage et al. 2013; Hansen et al. 2016; Coop et al. 2020; Hill et al. 2023). Although the northern Rockies have been an important region for the study of fire-climate-vegetation research in the paleontological (e. g., Millspaugh 1997; Huerta et al. 2009; Higuera et al. 2010; Power et al. 2011; Krause and Whitlock 2017; Iglesias et al. 2018; Stegner et al. 2019) and neontological record (e. g., Turner et al. 1997, 1999; Schoennagel et al. 2004; Donato et al. 2016; Hansen and Turner 2019), we know far less about recent, long-term (multi-decadal to millennial) impacts of fire regime on vertebrates, and especially small mammals (Lyon et al. 2000; Culhane et al. 2022) that make up the majority of mammal diversity (Damuth 1987).
Because of the rarity of and temporal mismatch between vertebrate fossil deposits and the paleoclimatic/paleofire records, there have been no studies attempting to directly link vertebrate community change with past fire dynamics in the northern Rockies. Here, we report on mammal community change in Waterfall Locality, a packrat midden spanning ~3,400 to 250 years before present (YBP) in northeastern Yellowstone National Park, USA. Evidence of fires at Waterfall Locality is provided by abundant charcoal in the midden and by fire-related debris flows throughout the watershed (Meyer et al. 1995a). Specifically, we address the question: did mammal diversity change over the last ~3,400 years, and, if so, are those changes related to changes in temperature, precipitation, and/or wildfire? Since the end of the Pleistocene, fire frequency in the vicinity of Waterfall Locality reached its highest level in the last 2000 years (Millspaugh 1997), so the period spanned by the deposits at this locality encompass important climatic and fire regime changes which herald further changes expected in the coming decades. In particular, Waterfall Locality captures the Medieval Climatic Anomaly (MCA; 950 AD to 1250 AD; Mann et al. 2009), which includes decadal periods of high temperature comparable to present day, though of lower intensity and higher overall variability (Heeter et al. 2021). Additionally, while packrats are well-known vectors of fossilization in arid regions of North America, packrat-accumulated sites have received less attention in montane environments (But see: Porcupine Cave, Colorado Rocky Mountains [Barnosky 2004]; Lamar Cave, Wyoming Rocky Mountains [Hadly 1996]; Signature, Haystack, and Cement Creek Caves, Colorado Rocky Mountains [McLean and Emslie 2012; McLean et al. 2014; Emslie et al. 2019]; Bear Den Cave, Sierra Nevada Mountains [Mead et al. 2006]) and thus Waterfall Locality contributes to our understanding of montane ecosystems, which are widespread and biologically important in North America.
Materials and methods
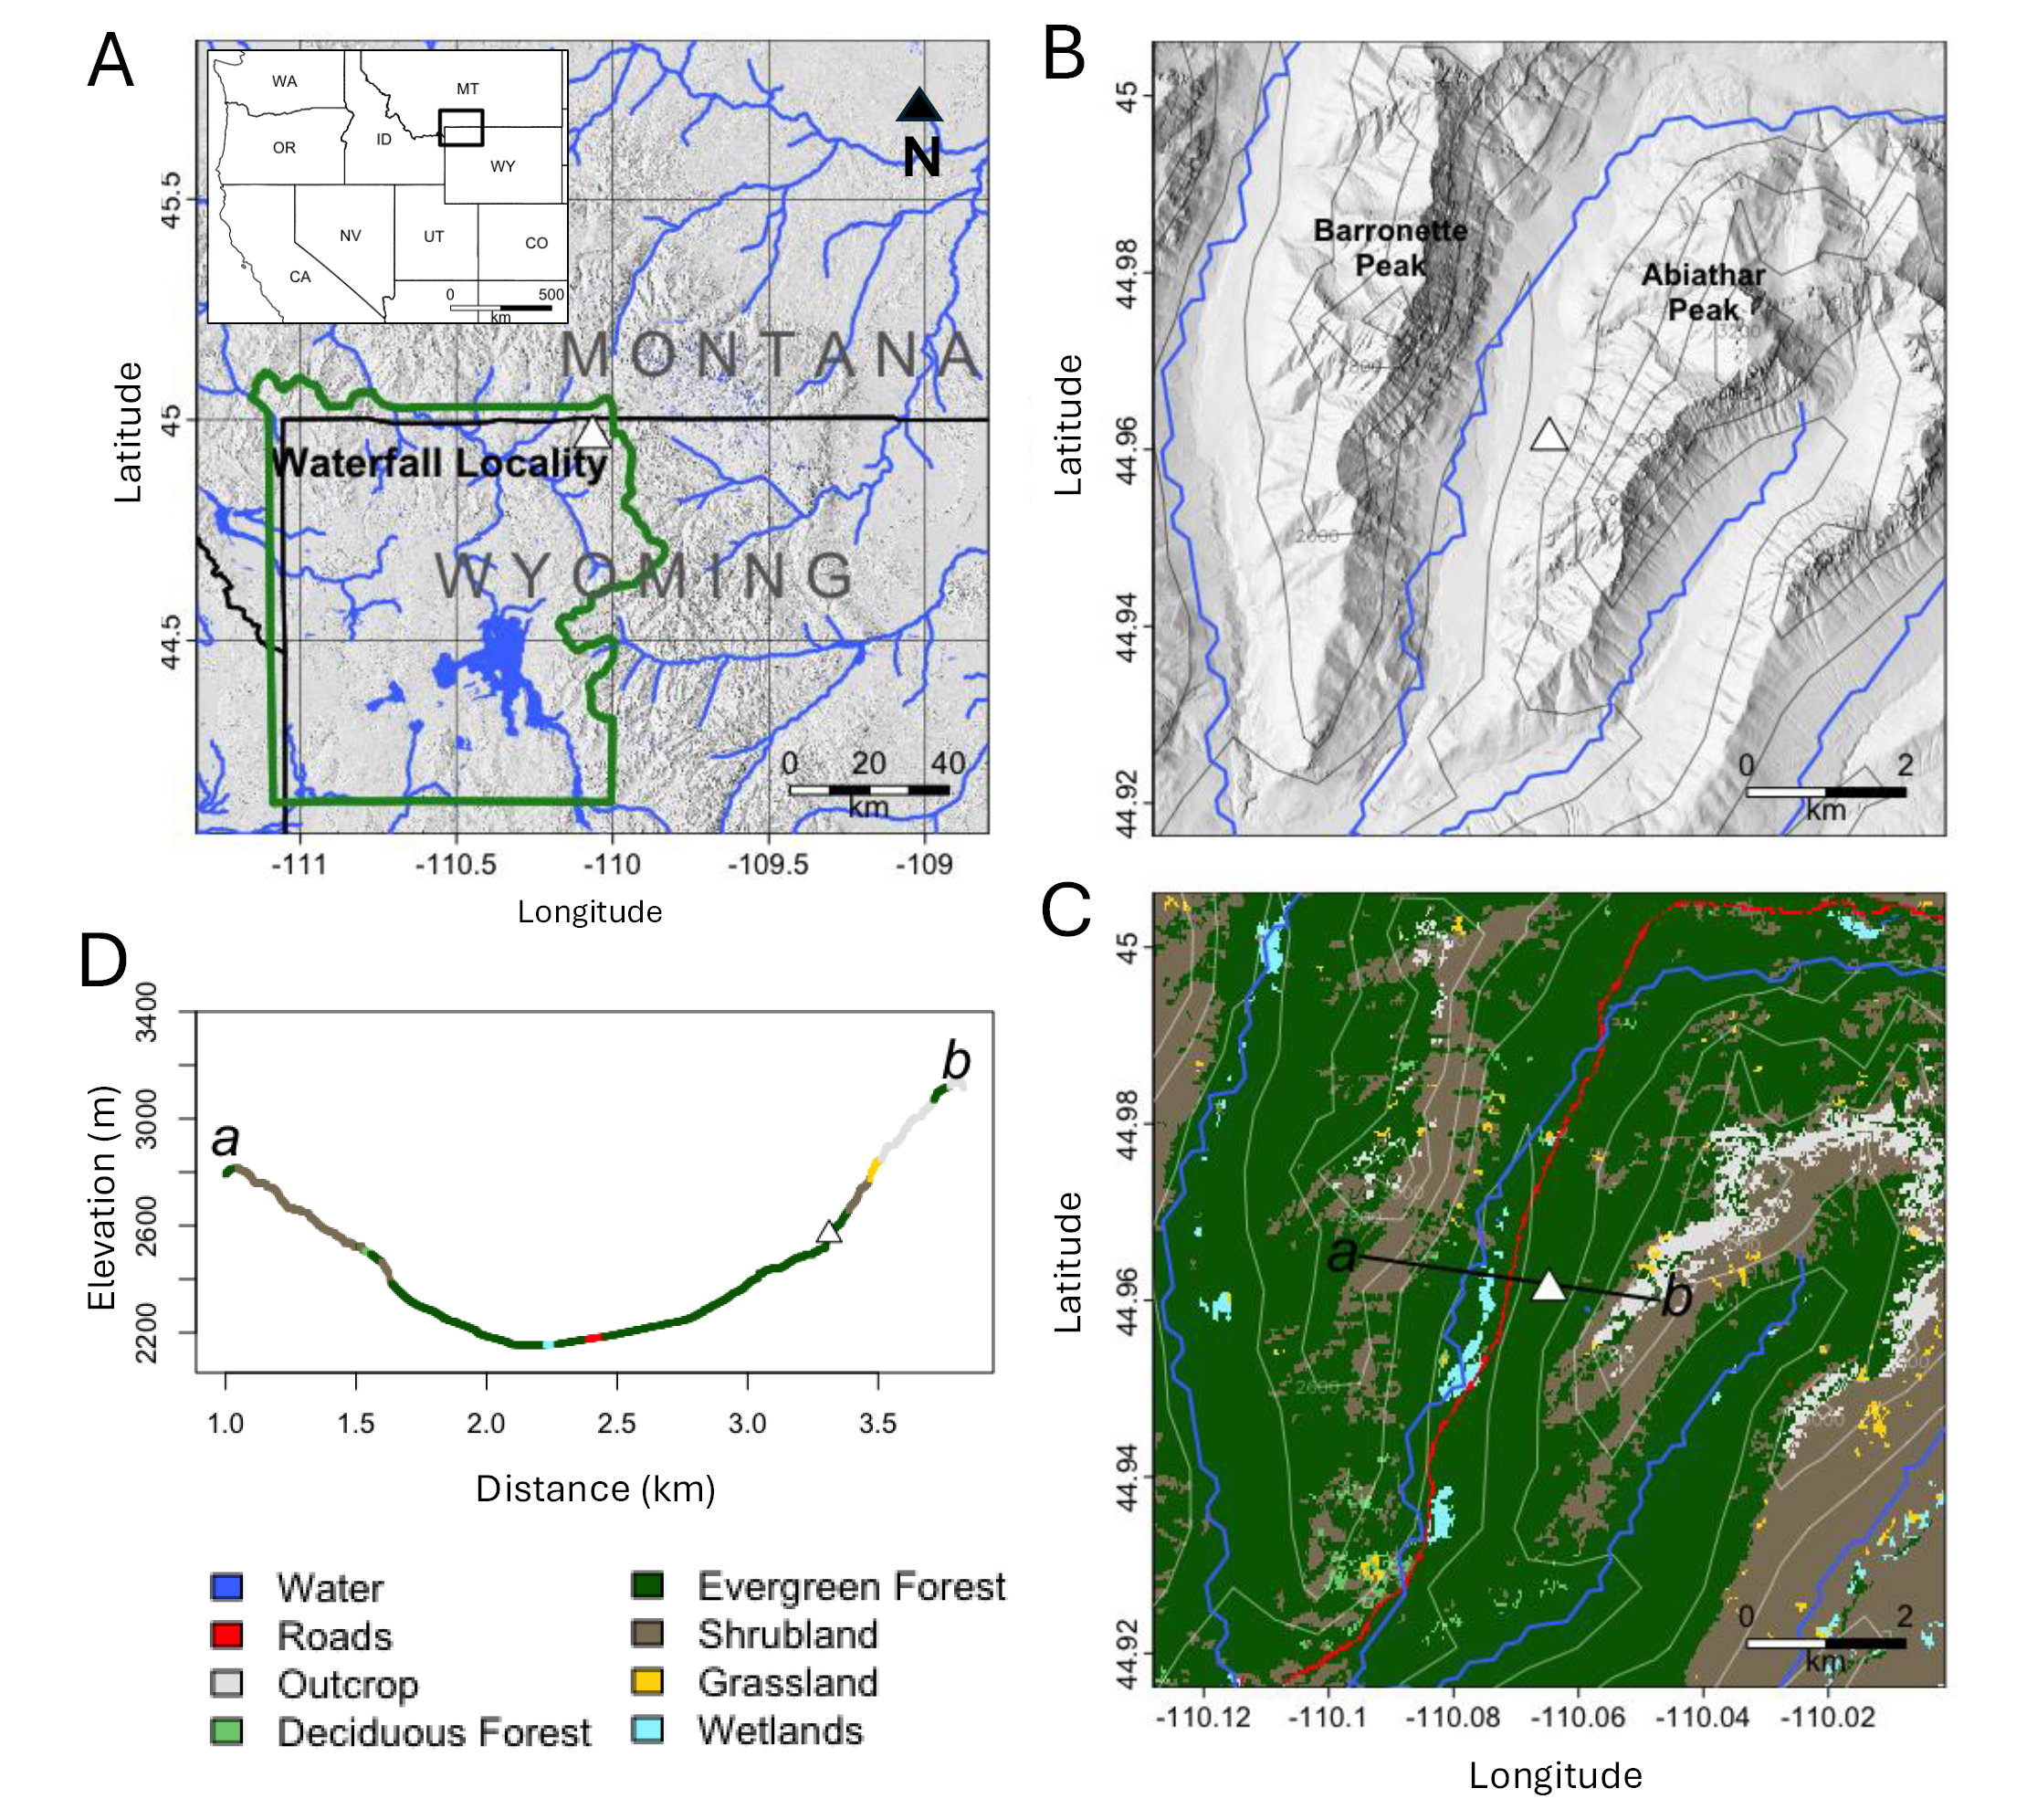
Site Description. Waterfall Locality is located along an unnamed drainage off Soda Butte Creek in northeastern Yellowstone National Park, USA, ~10 km southwest of Silver Gate, Montana, at an elevation of 2,260 m (latitude 44.96120, longitude -110.06473; Figure 1). The vegetation around Waterfall Locality today is a mosaic of Douglas-fir forest/woodland, spruce-fir forest/woodland, lodgepole pine forest, subalpine woodland, montane meadows, sagebrush steppe, and riparian communities (LANDFIRE 2022; Figure 1C and D). Spruce-fir forest immediately surrounds the deposit. Northeastern Yellowstone receives most of its precipitation in spring and summer, and winters are fairly dry (Whitlock and Bartlein 1993); average annual precipitation in the area is 80 cm (Licciardi and Pierce 2018). The site is a packrat midden accumulation in a fissure beneath a dolomite cliff, which was discovered in 1990 when a flood in the drainage eroded the front of the midden and exposed the accumulation. The maximum dimensions of the deposit prior to excavation were approximately 2.2 m high, 3.0 m wide, and 3.0 m deep (Figure 2a). Immediately upstream, the slope becomes very steep with sparse vegetation through treeline (~2,700 m) up to Abiathar Peak (3,332 m; Figure 1C and D).
Prior to excavation, the surface of the accumulation was covered with packrat scats, conifer needles, dolomite clasts, sticks, and miscellaneous debris. Because the accumulation is situated in a narrow vertical fissure, it is evident that the carnivore scats, raptor pellets, miscellaneous bones and other materials were collected by packrats (Neotoma cinerea), and that this site did not function as a carnivore den. Additionally, the bones show evidence of rodent gnawing, but not of carnivore gnawing, and the bones are generally quite small (<3 cm). The few large mammal species present in the assemblage are represented by small specimens likely derived either from carnivore scats or possibly from animal carcasses found near the midden. Previous research has demonstrated with high confidence (95 %) that the sampling radius for bones recovered from Waterfall Locality is 17.5 km or less (Porder et al. 2003).
Excavation. Waterfall Locality was excavated in June and July of 1991 by Elizabeth A. Hadly and a team of field assistants (NPS Permits YELL #00200; YELL #05638). The deposit was interspersed with dolomite roof falls and occasional flooding of the site from the adjacent unnamed creek. These sedimentary events helped to define discrete sections of the midden and facilitated excavation in natural stratigraphic units. Unit numbers from 1 to 19 were assigned from top to bottom for the natural strata. Strata thicker than 10 cm were subdivided into arbitrary units A through C, although these subunits were analytically combined for this study, with the exception of Unit 9A (Supplemental 1). Prior to excavation, talus around the accumulation was cleared and designated as “Undifferentiated.” Excavation was done by hand with a trowel, and excavated material was placed in buckets and washed through a series of five stacked screens of decreasing mesh size (4, 8, 16, 20, and 30 squares per square inch). Matrix was dried in the field, bagged, and transported to the lab. During excavation, the deposits collapsed twice, and the collapsed material was collected and designated as “Undifferentiated Units 1-3” and “Undifferentiated above Unit 14.” Specimens are deposited with the Heritage and Research Center in Yellowstone National Park.
Chronology. To develop a chronology, we radiocarbon-dated 8 bone and 13 charcoal samples (Table 1). Samples were selected to span the deposits, and to target particularly fossiliferous units. We dated multiple samples for some units to better understand time-averaging within units and through the deposit. Of the fossil-bearing units, 1, 4, and 15 were not directly dated. Unit 1 is considered modern. When possible, we paired bone and charcoal dates to assess whether there were systematic differences in age estimates from these sources. All samples were dated using accelerator mass spectrometry (AMS), with the exception of two large charcoal pieces (AA-7962 and AA-7963, Table 1). We rejected one date (CAMS-83292) because it was ~40,000 years older than the second oldest date, also from level 16, and is unlikely to be accurate. Note that this area was covered by glaciers until at least 14,900 YBP (Licciardi and Pierce 2018).
Using the Bchron package (Haslett and Parnell 2008) in R (R Core Team 2021), radiocarbon dates were calibrated using the IntCal20 calibration curve (Reimer et al. 2020). We generated a Bayesian age model using the accepted radiocarbon dates and the top of the deposit as chronologic controls (Figure 3).
To assess the effect of charcoal versus bone samples on estimates of the age of each unit, we created three Bayesian age models using just charcoal, just bone, or both charcoal and bone dates (including the age of the top of the deposit as the year of excavation in all cases). We then examined overlap of the 95% confidence intervals for all three models (Supplemental 3).
Taxonomic Identification. Fossil material was removed from the sieved bulk matrix by hand or with forceps and sorted taxonomically. Mammalian remains were identified to the lowest taxonomic level possible, typically genus or species. For rodents, lagomorphs, and insectivores, only craniodental material was used for identification; all other mammals (carnivores and artiodactyls) were identified based on both cranial and post-cranial diagnostic specimens. Comparative material from the University of California Museum of Vertebrate Zoology and from the Hadly Morphology Laboratory (Stanford University, California, USA) comparative collections (including vertebrate specimens collected within Yellowstone National Park; permits YELL #00200; YELL #05638) were used to aid identifications. Plant, mollusk, insect, and bird material were not identified, and no fish, reptile, or amphibian remains were recovered at the site.
Analysis of diversity change. We calculated the number of identified specimens (NISP) and minimum number of individuals (MNI) for each taxon and traced changes in diversity through time using taxonomic richness, relative abundance, and evenness. We excluded large-bodied mammals and carnivores from diversity analyses because they were likely introduced to the deposit via different taphonomic pathways than small mammals, which would have been embedded in carnivore scats or raptor pellets (Hadly 1999). To account for differences in sample size, we standardized species richness using Shareholder Quorum Subsampling (SQS) at a coverage level of 0.8 (Alroy 2010). In contrast to rarefaction which fixes sample size, SQS fixes coverage, the proportion of the entire frequency distribution represented by the species in the resample. SQS-estimated richness values are lower than raw richness but are linearly proportional to one another, and species-rich sites are not penalized as they are in rarefaction (Alroy 2010). Evenness was calculated using Hurlbert’s probability of interspecific encounter (PIE; Hurlbert 1971). We computed variance in PIE following Davis (2005) with a sample size of 20 and 1000 iterations. Because time bins are likely to be serially autocorrelated, we assessed significant differences in PIE among time bins by comparing overlap in variance (Blois et al. 2010; Stegner 2016). We calculated relative abundance from the NISP. Previous research has shown that NISP is a less-biased indicator of the relative importance of a taxon as compared to MNI (Blois et al. 2010; Grayson 1978).
To understand the role of shifting environments in driving diversity change at Waterfall Locality, we classified taxa as associated with closed habitats (i. e., forest), open habitats (grassland, riparian, etc.), or no preference (Supplemental 4). Information about habitat preference was assembled from Foresman (2001), Streubel (1995), and Zeveloff (1988) and from personal small-mammal trapping experience in the montane western USA. We compared relative abundance of open versus closed taxa through time and calculated the 95 % confidence intervals around each relative abundance estimate using Goodman’s (1965) simultaneous confidence intervals (Calede et al. 2011; McHorse et al. 2012; Stegner 2016), as calculated in the R DescTools package (Signorelli et al. 2015).
Changes in sampling vectors. Raptor pellets and mammalian carnivore scats are a common component of packrat middens and are the primary source of bone in these deposits (Hadly 1999). Because scats and pellets from either nocturnal or diurnal predators may be represented in packrat middens, changes in the relative abundance of nocturnal and diurnal prey species recovered from the deposit are indicative of a change in predator composition, and therefore a change in taphonomy. This is important to understand because shifts between predominantly nocturnal or diurnal taxa in the deposit could be mistaken for community turnover on the landscape. We analyzed the proportion of nocturnal versus diurnal taxa found in Waterfall Locality through time. We initially classified small mammals as strictly diurnal, mostly diurnal, no preference, mostly nocturnal, or strictly nocturnal. We then quantified relative abundance of mostly/strictly diurnal and mostly/strictly nocturnal and calculated Goodman’s simultaneous confidence intervals.
Influence of climate on mammal community composition. We tested for a relationship between four biodiversity metrics—taxonomic richness (SQS), evenness (PIE), proportion of closed habitat taxa, and proportion of open habitat taxa—and seven measures of past climate. Climate variables were mean annual temperature, minimum winter temperature, maximum summer temperature, temperature seasonality, mean annual precipitation, mean summer precipitation, and precipitation seasonality. We used PaleoView (Fordham et al. 2017) to download modeled climate time series data averaged over 30-year intervals with 20-year interval steps, for the finest latitude/longitude grid cell (latitude: 42.5 to 45.0° N, longitude: 112.5 to 110.0° W) that included Waterfall Locality. We estimated the value of each climate variable during the time when each excavation level was deposited. To account for the age range of each excavation unit, we resampled the ages for each level from the Bayesian age model posteriors, which represent the iterative model runs for the age model. We matched each of the 1000 age estimations for each level to the closest age in the climate time series to calculate a range of possible climate values for each level.
To correlate each climate variable to each of the biodiversity measures, we sampled the distribution of possible climate values for each level, calculated the Pearson’s product moment correlation between the biodiversity metric and climate through time, then reiterated this process 1000 times. This generated a distribution of observed Pearson’s test statistics. We compared this to a distribution of null Pearson’s test statistics generated by permutation. We used student’s t-tests to determine if the distributions of observed and null test statistic distributions were significantly different from one another.
In Thomomys talpoides, the pocket gopher found at Waterfall Locality, mandibular diastema length has been shown to be an ecophenotypically controlled trait related to nutritional quality and elevation (Hadly 1997). To assess the elevation from which specimens in Waterfall Locality were derived over time, following Hadly (1997), we measured T. talpoides diastema length for comparison to previously published data from modern and fossil T. talpoides in the Yellowstone region.
Influence of wildfire on mammal community composition. Millspaugh (1997) estimated fire frequency over the last 2000 years at Slough Creek Pond (~25 km west of Waterfall Locality) to be between 12 and 17 fires per 1000 years, meaning that fires were taking place every ~60 to 80 years on average in the surrounding sagebrush/grassland. The upper Soda Butte Creek drainage where Waterfall Locality is located is in a narrow canyon at a higher elevation and dominated by a mixed forest comprised of spruce (Picea engelmannii)/fir (Pseudotsuga menziesii)/lodgepole pine (Pinus contorta) forest. Analyses of stand age and fire scars in these forests suggest that fires occur less frequently than in sagebrush/grasslands: on average every 100 to 300 years (Romme and Knight 1982; Romme and Despain 1989).
In northeastern Yellowstone National Park, large fire events over the past 3,500 years were found to be followed by fire-related sedimentation events such as debris flows (Meyer et al. 1992; Meyer et al. 1995a). Meyer et al. (1995a) radiocarbon dated charcoal from debris flows along streams in the Soda Butte Creek basin, which includes Waterfall Locality. Charcoal is produced by wildfires, and it becomes entrained in debris flows when precipitation falls on steep, burned areas which are highly susceptible to erosion and are characteristic of the glacially over-steepened Soda Butte Valley (Meyer et al. 1995a). Debris flows are deposited on alluvial fans along streams and rivers and are characterized by poorly sorted muddy sands with abundant charcoal and organic material (Meyer et al. 1992). The “old wood” effect—the combined effect of dating long-lived organisms like trees and the long environmental residence time of charcoal—may affect these charcoal dates. The debris flow charcoal data providing a record of past wildfires in the vicinity of Waterfall Locality has a systematic age bias of <80 years, where charcoal ages predate fire events by ~60 to 80 years.
The estimated probability density of fire-related debris flows in upper Soda Butte Creek used summed probability densities of the charcoal radiocarbon dates (Meyer et al. 1995a). It has since been shown that summed probability densities of radiocarbon dates conflate age uncertainty with process variation (Carleton and Groucutt 2020), in this case variation in fire frequency. Therefore, to quantify past fire activity, we evaluated the number of charcoal pieces as a proxy for the number of fires through time. Meyer et al. (1995a) examined 58 likely or definite debris flows throughout the basin. The authors generally sampled one piece of charcoal per debris flow and noted how confident they were that the material came from a debris flow and instances where an event was sampled multiple times. This charcoal sampling method differs from typical charcoal counting methods in sediment cores (e. g. Ejarque et al. 2015) and so the commonly applied CharAnalysis method (Higuera et al. 2009) for reconstructing past fire events was not possible in this case. We included only one charcoal piece per debris flow, so the dataset used here, which includes 53 charcoal samples, is not biased by over-representation of particular fire events. Instead, we estimated the number of charcoal pieces in hundred-year time bins by sampling the calibrated age distribution of each charcoal sample, tallying the number of charcoal samples in each time bin, and iterating 1,000 times. We calculated the median and 95 % confidence interval across iterations. Number of charcoal pieces per century was then qualitatively compared to relative abundance of closed versus open habitat taxa and compared to the known climatic anomalies such as the Medieval Warm Period.
Results
Excavation and Stratigraphic Interpretation. The deposits are comprised of alternating organic-rich packrat midden material, alluvium, dolomite clasts from roof fall, and flood deposits containing Eocene volcanoclastic-derived gravels and cobbles which were likely deposited over hours to days when the adjacent stream overflowed (Figure 2b; Supplemental 1). Bones of bushy-tailed packrats (Neotoma cinerea) are present throughout the assemblage, as are Neotoma scat and midden materials, providing a consistent indicator that this species accumulated the organic deposits. Charcoal was found in varying concentrations throughout. Bone preservation at all levels was generally sufficient for identification, although bones were frequently broken. Only one articulated skeleton was found, belonging to a chipmunk (Tamias sp.).
Units 3, 5, 7, 11, 17, 18, and 19 represent either roof fall or debris flow deposits and although some bone was recovered in most of these units (Supplemental 2), this was likely due to contamination from units above or below and thus these materials were not included in our analyses.
Chronology. Ages of both bone and charcoal are generally older with increasing depth, although there is time-averaging within stratigraphic units (Table 1, Figure 2). For the seven units where both bone and charcoal were dated, in all but one case (Unit 10) the charcoal dates were older than the bone dates (mean difference = 296 years older). Some difference within the same unit is expected due to time-averaging, but a systematic bias of older charcoal dates suggests the “old wood” effect (e. g., Schiffer 1986), deviations which depend on the sources of charcoal. Common trees in the vicinity and particularly upstream of Waterfall Locality today include Engelmann spruce (Picea engelmannii) and subalpine fir (Abies lasiocarpa), which can live over 500 years and 250 years respectively, which is on par with the mean difference in age between charcoal and bone samples from the same excavation units. Differences in radiocarbon ages even within individual trees may span centuries (Piovesan et al. 2018), suggesting that charcoal from long-lived individual trees may also span hundreds of years in this area.
When we compared Bayesian age models using dates from only charcoal or only bone samples, we found differences between the two models for most of the record (Supplemental 3). The charcoal model was older than the bone model for Units 2 and 13 to 17 (with some overlap confidence intervals), but younger in Units 7, 8, 9A, and 10. Given these differences and the likelihood that the charcoal is older than the bone deposited at each level, for all analyses we used the age model which included only radiocarbon dates on bone chronologic controls (Figure 3).
There was considerable overlap in the estimated ages for Units 8 and 9, and Units 12 and 13, implying rapid deposition. We therefore combined these two pairs of units, creating Units 8-9 and Unit 12-13, for all subsequent analyses.
Taxonomic Identification. Mammalian faunal remains (2,406 identifiable specimens) recovered from Waterfall Locality span approximately 3,400 years and represent 5 orders, 12 families, and at least 26 genera and 29 species (Table 2; Supplemental 2). Small and medium-sized mammals (discussed below in Section 4.4) were the most common taxa found in the deposit. Large-bodied herbivores (Cervus elaphus, Odocoileus hemionus, Bison bison, Ovis canadensis, Erethizon dorsatum) and carnivores (Puma concolor, Lynx sp., Mustela erminea, Mustela frenata, Neovision vision) appeared sporadically in the deposits, but were too rare to be analyzed statistically (Table 2, Supplemental 2). Although bird fossils were recovered (not discussed here), the site does not contain other vertebrates such as bats, fish, amphibians, or reptiles.
Changes in Small Mammal Diversity. SQS-corrected richness ranged from 3.2 to 5.9, representing an almost 2x increase in richness from the least to the most diverse level (Units 15 and 2, respectively; Table 3). Fluctuations in taxonomic richness were otherwise relatively small across the record. Evenness (PIE) ranged from a minimum of 0.78 (95 % CI = 0.67 – 0.86) in Unit 10, to a maximum of 0.92 (9 5% CI = 0.85 – 0.95) in Unit 8-9, and overlapped for all levels, except that Unit 10 had significantly lower evenness than Unit 9A (and had negligible overlap with Units 16 and 8-9) (Table 3).
Microtus spp., Urocitellus armatus, Neotoma cinerea, and Thomomys talpoides were the most abundant taxa found throughout the record (Figure 4). Neotoma cinerea was not found in Unit 10, and Urocitellus armatus was missing from Unit 9A, but sample sizes in these units were low (26 and 36 specimens respectively). Leporidae as a group were found throughout, but more taxonomically resolved species—Lepus sp., Lepus c.f. L. americanus, Sylvilagus c.f. S. nuttallii, and Ochotona princeps—occurred sporadically, possibly because lagomorphs are difficult to identify to species- or even genus-level. Sciuridae, Tamias spp., Peromyscus maniculatus, and Phenacomys intermedius were present in relatively low abundances throughout the record.
Early in the record, in Units 16 through 12-13, (3,408 – 2,594 cal YBP, 95% CI = 5,030-2,455 cal YBP), the major components of the small mammal community included Neotoma cinerea, Microtus spp., Myodes gapperi, Thomomys talpoides, Sorex sp., leporids, and, in lower abundances, Urocitellus armatus, Callospermophilus lateralis, Tamias spp., Peromyscus maniculatus, Phenacomys intermedius, and Zapus princeps (Figure 4). In Unit 14 (2,784 cal YBP, 95 % CI = 3,036 – 2,705 cal YBP), Urocitellus armatus began to increase, reaching a peak in Unit 12-13 (2,594 cal YBP, 95 % CI = 2,721 – 2,455 cal YBP), and Glaucomys sabrinus appeared in low abundance in Units 14 and 12-13. Also in Unit 12-13, we found Marmota flaviventris.
There was an overall community shift in Units 10 (2,417 cal YBP, 95 % CI =2,585 – 2,139 cal YBP) and 9A (1,627 cal YBP, 95 % CI = 2,308 – 1,380 cal YBP) as compared to earlier units, though the timing varied somewhat among taxa. Beginning in Unit 10, Myodes gapperi, Thomomys talpoides, and Zapus princeps disappeared while Tamiasciurus hudsonicus and Microtus sp. increased (Figure 4). Callospermophilus lateralis increased to peak abundance in Unit 9A, simultaneous with an isolated appearance of Ochotona princeps. Tamias spp., Peromyscus maniculatus, Phenacomys intermedius, Leporids, and Sorex spp. persisted.
In Unit 8-9 (1,580 cal YBP, 95 % CI = 2,256 – 1,237 cal YBP) and above, we saw recovery of some taxa that had been common in Unit 12-13 and earlier (before ~2,600 cal YBP), including Urocitellus armatus, Myodes gapperi, and Thomomys talpoides (Figure 4). Glaucomys sabrinus and Marmota flaviventris returned in low abundance. However, Callospermophilus lateralis and Tamiasciurus hudsonicus declined after Unit 8-9. Tamias spp. increased in Unit 6 (1,389 cal YBP, 95 % CI = 1,919 – 879 cal YBP), Zapus princeps returned in Units 2 (502 cal YBP, 95 % CI = 603 – 367 cal YBP) and both Z. princeps and Ochotona princeps were found in Unit 1 (257 cal YBP, 95 % CI = 446 – -52 cal YBP).
Overall, the community experienced a shift between Units 12-13 and 10, and again between Units 9A and 8-9, reflected in the change in proportion of closed versus open habitat taxa through time (Figure 5). Closed habiat taxa were more abundant than open habitat taxa in Units 16 (3,553 cal YBP, 95 % CI = 5,288 – 2,818 cal YBP) and 15 (2,950 cal YBP, 95 % CI = 3,726 – 2,773 cal YBP) where there was no overlap in confidence intervals, and likely in Unit 14 (2,784 cal YBP, 95 % CI = 3,099 – 2,698 cal YBP). In Units 12-13 through 9A (2,594 – 1,627 cal YBP, 9 5% CI = 2,721 – 1,380 cal YBP), open and closed habitat taxa were more or less equally abundant, but the proportion of closed habitat taxa did not decline from before. In Units 8-9 (1,580 cal YBP, 95 % CI = 2,256 – 1,237 cal YBP) and 6 (1,389 cal YBP, 95 % CI = 1,919 – 879 cal YBP), however, open and closed habitat taxa were still equally abundant, but closed habitat taxa declined sharply. Beginning in Unit 4 (927 cal YBP, 95 % CI = 1,245 – 692 cal YBP), open habitat taxa were more abundant than closed habitat taxa, and the proportion of closed habitat taxa remained lower than in the earlier half of the record.
Changes in nocturnality and diurnality of small mammals. Although the relative abundance of nocturnal and diurnal species fluctuated through time (Figure 5), nocturnal taxa were more abundant across the record, and significantly so for most units. The abundance of taxa with no diel preference declined from Unit 16 through Unit 10, then remained stable, and low, through time. There was very slight overlap in the Goodman’s 95 % confidence intervals for relative abundances of nocturnal and diurnal taxa in Units 12-13 (2,594 cal YBP, 95 % CI = 2,721 – 2,455 cal YBP), 10 (2,417 cal YBP, 95 % CI =2,585 – 2,139 cal YBP), 9A (1,627 cal YBP, 95 % CI = 2,308 – 1,380 cal YBP), and 4 (927 cal YBP, 95 % CI = 1,245 – 692 cal YBP), but nocturnal taxa were more common overall. The only exception was Unit 12-13 where relative abundances of nocturnal and diurnal taxa were very similar (53 % and 47 % respectively) and there was considerable overlap in confidence intervals.
Influence of climate on mammal community composition. Our model shows that, early in the record (~3,400 – 3,000 cal YBP), annual temperatures increased, mainly driven by increases in winter temperature, while annual precipitation declined (Supplemental 5). From ~3,000 – 2,000 cal YBP, winter (and annual) temperature declined again while precipitation declined slightly. From ~2,000 – 1,000 cal YBP, winter (and annual) temperature increased sharply then declined again, and precipitation was lower than previously. After ~1000 cal YBP, summer temperature increased, associated with the onset of the Medieval Climate Anomaly (MCA), but by ~500 cal YBP winter temperature decreased, associated with the Little Ice Age. The net effect was an increase in temperature seasonality over the last 1000 years, paired with a continued decline in precipitation and increasing summer temperature.
In our analysis of the relationship between climate variables and measures of both diversity (richness and evenness) and community composition (proportion of open- and closed-habitat taxa), which combined age model resampling and permutation tests, we found that precipitation was an important factor. Although most metrics were significantly more correlated with climate than random, the strength of the correlation, reflected in the Pearson’s correlation coefficient, was very low (< |0.1|) for most relationships, indicating no effective relationship (Table 4; Supplemental 5). However, annual precipitation was slightly more strongly negatively correlated with SQS (mean correlation coefficient = -0.22) and the proportion of open habitat taxa (correlation coefficient = -0.32). We saw a stronger signal with summer precipitation, which was negatively correlated with the proportion of open habitat taxa (mean correlation coefficient = -0.42) and positively correlated with the proportion of closed habitat taxa (mean correlation coefficient = -0.37). Overall, this suggests that higher summer precipitation contributes to a higher proportion of closed habitat taxa, at the expense of taxa which favor open habitats.
The diastema length of fossil Thomomys talpoides from Waterfall Locality ranged from 6 to 9 mm, with a mean of 6.75 mm (Supplemental 6). Sample size was too small to establish a trend through time or with climate, but diastema length was larger in Units 14 (2,784 cal YBP, 95 % CI = 3,036 – 2,705 cal YBP) and 8-9 (1,580 cal YBP, 95 % CI = 2,256 – 1,237 cal YBP), and smaller in Units 12-13 (2,594 cal YBP, 95 % CI = 2,721 – 2,455 cal YBP) and 4 (927 cal YBP, 95 % CI = 1,245 – 692 cal YBP), both of which only had N = 1. The diastema length for fossil T. talpoides from Waterfall Locality was larger on average than both fossil and modern populations at nearby Lamar Cave (1,835 m), which is lower in elevation than Waterfall Locality (Hadly 1997). Waterfall Locality T. talpoides had similar diastema sizes to modern specimens from nearby populations at higher elevations such as Canyon (2,590 m) and Cooke City (2,560 m), which averaged from 6.5 to 7.0 mm (Hadly 1997).
Influence of wildfire on mammal community composition. Estimated number of fire events (i. e., charcoal pieces) averaged zero to one per century from 3,300 – 2,200 YBP, then increased to an average of one to two per century from 2,200 – 1,400 cal YBP (Figure 5). From 1,400 – 1,200 YBP, the average number of charcoal pieces per century was zero but increased again to an average of one to two per century from 1,200 – 400 cal YBP, before returning to an average of zero per century from ~400 cal YBP to present.
Discussion
Large fires that alter habitat cover in the Yellowstone ecosystem have burned periodically since the last glacial period (Millspaugh et al. 2000; Huerta et al. 2009; Higuera et al. 2010; Power et al. 2011). Reconstruction of the mammal community from Waterfall Locality offers a ~3,400-year record of mammal diversity in lower montane ecosystems of the northern Rocky Mountains, linked to vegetation type, climate, and fire regime change over time. Although past research has explored the relationship between these factors in the northern Rocky Mountains over paleoecological time scales, vertebrate fossil localities are rare in this system and so there has been less attention to the ways in which the biota has responded to these long-term changes. Understanding linked abiotic and biotic dynamics is important for anticipating how these taxa will respond to future climate and fire regime change.
While vegetation type is a major determinant of animal diversity in general, small mammals are also very responsive to fire (e. g., Culhane et al. 2022). Thus, comparisons of small mammal communities across sites can be a robust indicator of changes in vegetation structure and composition (i. e., Grant and Birney 1979; Culhane et al. 2022). Mammals found in Waterfall Locality deposits are typical of the Yellowstone region today and include taxa associated with grassland, sagebrush, forest, and riparian habitats (Supplemental 4, Hadly 1999). Microtus spp. (voles), Urocitellus armatus (Uinta ground squirrel), and leporids (rabbits and hares) persisted throughout the deposit. Urocitellus armatus is characteristic of sagebrush grassland with sparse cover (Streubel 1995; Barnosky 1994; Hadly 1996, 1999; Craighead 2000) and leporids are often indicators of dry shrublands and ecotones, except Lepus americanus (snowshoe hare) which is found in closed forest (Streubel 1995; Hadly 1996). Most of the Microtus specimens from Waterfall Locality were not identified to species and thus we were not able to track turnover in Microtus species through time, but we know that all four species found in Yellowstone today were also present in Waterfall Locality: M. pennsylvanicus (meadow vole) and M. richardsonii (water vole) were morphologically identified and found sporadically, while M. longicaudis (long-tailed vole) and M. montanus (montane vole) were confirmed using aDNA in a study by Spaeth et al. (2009). Of the 15 samples in this genetic dataset, 12 belonged to M. longicaudis while only 3 were M. montanus. While all four Yellowstone Microtus species are common in wet meadows and grasslands (Viteri et al. 2021; Streuble 1995), the high numbers of M. longicaudis relative to M. montanus are consistent with a forested environment (Anich and Hadly 2013). These taxa provide evidence that grassland and shrubland environments were consistently present in the vicinity of Waterfall Locality over the last ~3,400 years, as they are today (Figure 1C and D). Closed habitat/forest-associated species are also found throughout the deposit, for example Tamiasciurus hudsonicus (red squirrel), Glaucomys sabrinus (flying squirrel), and Myodes gapperi (Southern red-backed vole).
Based on the mammal community, it is clear that over the last ~3,400 years there were changes in the relative proportion of habitats within the sampling radius of Waterfall Locality. We found an overall decline in the proportion of mammal taxa associated with closed habitats (i. e., forests), coincident with an increase in taxa associated with open habitats (grasslands and shrublands) (Figure 5). These changes in the small mammal community were likely mediated by vegetation changes that led to a greater proportion of open environments in the vicinity of the site. Forested habitat was most widespread around Waterfall Locality before ~ 2,800 cal YBP, but open environments began to expand after ~2,600 cal YBP and eventually became dominant after ~1,500 cal YBP. We also found that higher summer precipitation was significantly positively correlated with the proportion of closed habitat taxa (and negatively correlated with the proportion of open habitat taxa). Vegetation reconstructions using pollen from sediment cores from nearby Slough Creek Pond, ~23 km to the west, show that there was a regional shift from forests dominated by lodgepole pine, limber pine, and juniper, to Douglas-fir parkland (more open environments with low tree density and non-continuous tree cover) beginning as early as 7,000 cal YBP, but especially after 3,000 cal YBP (Millspaugh 1997, Whitlock and Bartlein 1993). As aridity increased from 4,000 – 2,000 YBP, sagebrush steppe and Pseudotsuga (Douglas-fir) and Pinus contorta (lodgepole pine) parkland expanded, and grasses increased (Whitlock and Bartlein 1993, Huerta et al. 2009, Whitlock et al. 2012). At Crevice Lake, further northwest but lower in elevation (576 m below Waterfall Locality), vegetation trends were similar to those at Slough Creek Pond: from ~8,200-2,800 cal YBP, Douglas-fir parkland increased, Pinus and Juniperus declined, and summers became drier over this period; from 6,000 to 2,000 cal YBP in particular, xerophytic forest expanded (Whitlock et al. 2012). A similar transition seems to have taken place at Waterfall Locality around 2,800 cal YBP, when we saw an initial increase in open habitat taxa in Unit 14. At Lamar Cave, ~28 km west of Waterfall Locality and 400 m lower in elevation, Hadly (1996) noted a warm climatic period from 2,850 to 2,050 cal YBP which likely contributed to this shift.
Individual taxa also corroborate our conclusion that open habitat expanded around Waterfall Locality as the climate became drier. Up until ~2,600 cal YBP, we found higher abundances of taxa associated with closed forests (e. g., Glaucomys sabrinus, Lepus americanus, and Myodes gapperi). Thomomys talpoides (northern pocket gopher) and Zapus princeps (western jumping mouse), which rely on grassy habitats (Streubel 1995; Barnosky 1994), were also found through this time, possibly suggesting the presence of montane meadows in the vicinity. The community ca. 2,600 cal YBP (Unit 12-13) had particularly diverse representation of mesic and closed forest-associated taxa, including Mustela frenata (long-tailed weasel), Lepus americanus, Thomomys talpoides, and Zapus princeps (Hadly 1996, 1997). Between ~2,400 and ~1,600 cal YBP, these mesic/forest species declined, and we saw increases in sciurids, like Urocitellus armatus, found in sagebrush and grassy habitats (Hadly 1996; Wilson and Ruff 1999); Callospermophilus lateralis (golden-mantled ground squirrel), which prefer mountain meadows, rocky habitats, forest edge and open woodland environments; and Tamiasciurus hudsonicus, which rely on spruce, fir, and pine forests (Wilson and Ruff 1999). An increase in xeric species is corroborated by the diatom ecology of Crevice Lake, ~40 km to the west, where summers from 2100 to 800 cal YBP likely began earlier and lasted longer (Whitlock et al. 2008). In sum, increases in these taxa suggest drying and opening habitats, a likely increase in sagebrush habitats, with persistence of some forests.
Forests may have recovered somewhat after ~1,600 cal YBP (beginning in Unit 8-9): Myodes gapperi reappeared and Phenacomys intermedius (western heather vole), also usually associated with forest environments, increased. Around 1,580 cal YBP (Unit 8-9) we also saw an increase in the more mesic indicator species Thomomys talpoides and brief return of Lepus americanus and Zapus princeps. However, aridification and expansion of open environments generally continued after this. Marmota flaviventris (yellow-bellied marmot) increased in abundance around 930 cal YBP (Unit 4). Although the primary habitat requirement of M. flaviventris is rocky outcrops, they are also associated with drier open habitats like sagebrush grassland and Douglas-fir parkland rather than closed forest. At Lamar Cave, the small mammal community reflects similar changes: beginning around 1,200 cal YBP and throughout the Medieval Climate Anomaly (MCA; ~1,000 – 650 cal YBP), xeric indicator taxa were more abundant than mesic indicator taxa, although mesic taxa recovered somewhat during the Little Ice Age (LIA; ~700 – 100 cal YBP). For example, the mesic taxa Microtus montanus and Thomomys talpoides both declined at Lamar Cave during the MCA then increased again during the LIA (Hadly 1996). Regional drought was severe enough during the transition from the MCA to the LIA (specifically, 717-588 cal YBP), that the Old Faithful Geyser ceased to erupt due to insufficient water (Hurwitz et al. 2020). This overall pattern matches the significantly higher proportion of open habitat taxa in Waterfall Locality around 930 cal YBP (Unit 4), corresponding to the MCA, as well as the slight decline in open habitat taxa around 500 cal YBP (Unit 2) and 260 cal YBP (Unit 1), corresponding to the cooler and wetter LIA (Figure 5). Indeed, moraines in the Soda Butte Creek drainage suggest that there may have been a local glacial advance during the LIA (Meyer 1995b). Several mesic/closed habitat taxa returned in Units 1 and 2, including Mustela frenata, Lepus americanus, and Ochotona princeps (American pika), while Marmota flaviventris declined (Table 2, Figure 3). However, Zapus princeps increased markedly after ~ 500 cal YBP, indicating that grasslands were still expanding, possibly corresponding to a slightly more mesic time during the LIA (Figure 5). Around 250 cal YBP, Myodes gapperi increased, suggesting increase in forest cover, consistent with emergence of larger, older trees after the LIA (Figure 3).
One incongruous pattern is that Thomomys talpoides declined in abundance from the MCA around 930 cal YBP (Unit 4) through the LIA around 500 cal YBP (Unit 2) and 260 cal YBP (Unit 1), which is counter to the trends seen at Lamar Cave, where T. talpoides was more abundant during the LIA than during the MCA (Hadly 1997). Although T. talpoides in the Yellowstone area are known to increase in abundance during more mesic times likely because of expansion of highly productive forbs (Hadly 1997), they are not forest species, instead preferring ecotones without dense tree roots. Thus, the decline in T. talpoides may indicate the maturation of the surrounding trees in the forest. The higher abundance of T. talpoides ~1,580 cal YBP (Unit 8-9) also corresponds to the largest diastema lengths, although our sample sizes were low (Supplemental 6). Diastema length (a proxy for body size) in the Yellowstone region generally correlates with elevation (Hadly 1997), and previous research has shown that the direct cause is nutritional quality (Smith and Patton 1988). The larger diastema at Waterfall Locality around 1,580 cal YBP (Unit 8-9), coupled with higher abundance, could correspond to the opening of forest and greater availability of ecotones and open habitat favorable for pocket gophers. Diastema length was also larger ca. 2,780 cal YBP (Unit 14), a period we interpret as having more closed forest. One possibility is that during this timeframe, the T. talpoides were coming from nearby alpine grassland (Figure 1 B-D). The topography around Waterfall Locality is very steep, so high elevation habitats are much more proximate than at Lamar Cave, for example.
Changes in taphonomy can influence the relative abundance of taxa in the deposit as compared to taxa on the landscape, obscuring interpretations of the true mammal community change (Hadly 1999). Possible taphonomic biases at Waterfall Locality include the following: 1) changes in the sampling radius through time such that more or fewer habitats are sampled, 2) changes in prey selection by predators over time, and 3) changes in predators through time. Porder et al. (2003) reconstructed the sampling radius of Lamar Cave and Waterfall Locality by comparing the Strontium (Sr) isotopes of bones found in these two fossil sites to Sr isotopes in vegetation around the site. The study showed that the collection radius of Lamar Cave, which has a geologic substrate that permitted a more fine-grained assessment, was 8 km or less. The collection radius around Waterfall Locality, with a more homogeneous bedrock in the vicinity, is 17.5 km or less. Neither site demonstrated a change in radius through time (Porder et al. 2003). With respect to changes in prey selection, Viteri et al. (2021) demonstrated that variation in the small mammal diet of raptor species in the Yellowstone region was driven by site rather than by raptor identity, that is, raptor species sample available diversity on the landscape rather than preferentially selecting certain prey species. We analyzed the composition of mammals in Waterfall Locality to determine if there had been changes in the proportion of nocturnal versus diurnal taxa, which would indicate a shift in predator identity, from nocturnal predators like owls to diurnal predators like avian raptors. We found that nocturnal taxa were consistently more common through time and the proportion was generally stable (Figure 5). However, the proportion of diurnal taxa was low from ~3,400 through ~2,780 cal YBP (Units 16 through 14), then increased and remained higher from ~2,590 through ~260 cal YBP (Units 12-13 through 1). This shift was driven by a decline in taxa with no diel preference. While the stability of nocturnal taxa suggests that there was no change in taphonomic biases influencing species abundance in Waterfall Locality, the increase in diurnal taxa may indicate an increase in avian raptors excluding owls. This is consistent with our interpretation of a closed forest habitat from ~3,400 (Unit 16) through ~2,780 (Unit 14) or ~2,590 cal YBP (Unit 12-13), because diurnal avian raptors are not typical in closed forest communities. These predators would likely have increased as the forest opened after ~2,590 cal YBP (Unit 12-13).
The modeled climate record suggests that, over the last ~3,400 years, climate changes were nonlinear and the various components of climate (temperature, precipitation, seasonality, etc.) changed in different ways at different times (Supplemental 5). However, while our analyses show that community composition was influenced by changes in precipitation, other climate factors did not have an evident impact on species richness (SQS) or evenness (PIE) based on our Pearson’s correlations and permutation tests. One possible explanation for the absence of an effect of climate on diversity is time-averaging and/or time-transgression within each unit. Duplicate and triplicate radiocarbon dates on Units 2, 6, 9, 10, 13, and 14 suggest that the excavation units encompass from ~300 to ~1100 years in time-averaging or time-transgression, and this may mask fine-scale signals of climate change in the faunal assemblage. However, we did detect an effect of precipitation on open versus closed habitat taxa, suggesting that it would have been possible to find climatic effects on richness and evenness if they had been present. Given the relatively coarse spatial scale (2.5° latitude x 2.5° longitude) of the PaleoView climate data used here, spatial averaging may also dampen our ability to detect relationships between climate and diversity, especially in a topographically complex region like our study area.
Our examination of the Meyer et al. (1995a) charcoal data, in which single charcoal pieces from individual fire-related debris flows were dated, shows increased numbers of fire-related debris flows from ~2,200 – 700 cal YBP, except from ~ 1,500 – 1,200 cal YBP when our estimate declined sharply (Figure 5). The increase in charcoal that we reconstructed coincides with the possible increase in open habitat taxa between ~ 2,420 and 1,630 cal YBP (Units 10 and 9A; Figure 5), suggesting that wildfire may have cleared the existing forests, and then either forest regeneration was inhibited/reduced by the more arid conditions, or forest was replaced with more open treed environments, like Douglas-fir parkland. Although there is some overlap in the timing of peak fire between Meyer et al. (1995a) and our reanalysis of the data—Meyer et al. (1995a) identified times of elevated fire-related debris flows from 2,300 – 2,050 YBP and 900 – 750 YBP in the Soda Butte Creek and Slough Creek drainages—the differences are likely due to the difference in method: Meyer et al. (1995a) used summed probability distributions to estimate fire frequency, whereas we estimated the number of fires from the number of debris flows (each dated with a single charcoal piece) and incorporated age uncertainly by resampling the calibrated age distributions.
Brown et al. (2020) found that fires in the Beartooth Mountains northeast of Waterfall Locality were more frequent but less severe in low elevation Douglas-fir and lodgepole pine-dominated vegetation than they were in higher elevation whitebark pine forests, so the sustained ~800-year period of elevated fire we found from ~2,300-1,500 cal YBP may have been reinforced by changing vegetation (Figure 5). There was a sharp decline in the mean estimate for taxa associated with closed/forested habitats around 1,580 cal YBP (Unit 8-9), coincident with the sharp decline in fire frequency. One plausible scenario is that wildfire burned a large proportion of the forest around Waterfall Locality immediately prior to this time, reducing the number of forest-associated mammals and also reducing fuels which could have supplied subsequent fires. Following this, fire frequency increased again from ~1,100 to 700 cal YBP, but open habitat taxa remained more common than closed habitat taxa, so fires may have been taking place in the open habitats like grasslands and sagebrush steppe. Additionally, the tree cover in these forests takes centuries to mature. These patterns roughly match estimated fuel biomass at Crevice Lake, where there were more fuels from ~4,500 – 1,600 cal YBP, and less from 1,600 – 300 cal YBP (Whitlock et al. 2012). Additional paleo-fire records from near Waterfall Locality will refine these interpretations. Sedimentary charcoal from Foster Lake, near the confluence of Soda Butte Creek and the Lamar River (Firmage 2019), is one such record, but uncertainty in the age model for Foster Lake makes comparison difficult.
Modern small mammal abundance patterns support the idea that elevated wildfire may have caused faunal turnover at Waterfall Locality. Wood (1981) surveyed small mammal communities in Yellowstone following wildfire and found that Tamias amoenus was more common in recently burned sites than in unburned control sites. At Waterfall Locality, Tamias spp. were more common from ~1,390 to ~930 (Units 6 and 4), consistent with elevated wildfire in the area from ~1,200 – 700 YBP (Figure 4 and 5). In a meta-analysis of small mammal abundance following wildfire, Zwolak (2009) found decreases in Myodes gapperi. At Waterfall Locality, Myodes gapperi, a closed/forest-associated species, was found in higher abundance from ~3,400 – 2,590 YBP (Units 16 through 12-13) than after ~2,420 (Unit 10 and above) when there were more fires (Figure 4 and 5). Numerous authors have found increases in Peromyscus maniculatus, a ubiquitous generalist species, following wildfires in North American coniferous forests (e. g., Wood 1981; Bunnell 1995; Converse et al. 2006; Zwolak 2009), but P. maniculatus varied little through time at Waterfall Locality. Bunnell (1995) showed that mammals were more impacted by fire size and hectares burned per year than by fire return interval, so reconstruction of fire events from charcoal—which does not reflect fire size—may provide only a partial picture. Nevertheless, our data suggest that changes in climate coupled with changes in fire frequency have long-term impacts on small mammal communities by altering habitat availability.
Mammalian species found in Waterfall Locality are common in Yellowstone today, and include taxa from grassland, forest, and riparian habitats. The persistence of these taxa throughout the Waterfall midden suggests that these environments were consistently present in the vicinity of Waterfall Locality over the last ~3,400 years but changed in their relative proportion through time. Our analyses of mammal fossil material from Waterfall Locality over the last ~3,400 years show that changes in the small mammal community—in terms of the relative abundance of individual taxa as well as taxa associated with open versus closed habitats—tracked changing summer precipitation and possibly changes in fire frequency. The small mammal community indicated a higher proportion of forested and more mesic habitats from ~3,400 to ~2,800 cal YBP. Increasing proportions of small mammals preferring open habitats, and species particularly associated with sagebrush, grasslands, and open habitats were seen from ~2,600 to ~900 cal YBP. From ~500 to ~250 cal YBP, within excavation units deposited during the Little Ice Age, we saw the return or increase of some mesic and forest-habitat mammals. Changes in the fire regime may have caused a shift toward more open-habitat taxa; further research would improve our ability to match the paleofire and fossil mammal data. Waterfall Locality represents a ~3,400-year record of mammal diversity in lower montane forests of the northern Rockies and indicates how the mammal community will adjust to changing climate and fire regimes mediated by habitat change.
Acknowledgments
James L. Patton, the iconic mammalogist, was my (EAH) advisor and, along with Carol, has become my friend for life. Like Jim, I am happiest in nature, although I thrive while working on fossil animals, not live ones. Jim showed me that even the lowly gopher has much to teach us about how the world works. Pocket gophers, who live oxygen-depleted, burrowing lives, while expending more than 1,000 times the energy of rodents living above ground, transform soils, plants and animal biodiversity. I have always thought that of Jim: he is hard-working, careful, single-minded, and has no use for wasted effort. As a mentor, Jim was a direct, yet kind and generous guide who taught me how to navigate through the things that don’t matter and to prioritize the things that do. Thank you, Jim, for the profound influence you have had on my research, my career, and my life.
Thanks to T. E. Steele for assistance identifying leporid remains, and to M. Viteri for comments on an early draft. These data were collected under National Park Service Permits YELL #00200 and YELL #05638.
Literature cited
Alroy, J. 2010. Fair sampling of taxonomic richness and unbiased estimation of origination and extinction rates. The Paleontological Society Papers 16:55–80.
Anich, P. S., and E. A. Hadly. 2013. Asymmetrical Competition between Microtus Montanus and Microtus Longicaudus in the Greater Yellowstone Ecosystem. American Midland Naturalist 170:274–86.
Barnosky, E. H. 1994. Ecosystem dynamics through the past 2000 years as revealed by fossil mammals from Lamar Cave in Yellowstone National Park, USA. Historical Biology 8:71–90.
Barnosky, A. D. 2004. Faunal dynamics of small mammals through the Pit sequence. Pp. 318-326, in Biodiversity Response to Climate Change in the Middle Pleistocene (Barnosky, A. D., ed.). University of California Press. Berkeley, USA.
Blois, J. L., J. L. McGuire, and E. A. Hadly. 2010. Small mammal diversity loss in response to Pleistocene climate change. Nature 465:773–775.
Bocinsky, R. K. 2024. FedData: Functions to Automate Downloading Geospatial Data Available from Several Federated Data Sources. R package version 4.0.1, https://CRAN.R-project.org/package=FedData.
Brown, S. R., et al. 2020. Fire history across forest types in the Southern Beartooth Mountains, Wyoming. Tree-Ring Research 76:27-39.
Bunnell, F. L. 1995. Forest-dwelling vertebrate faunas and natural fire regimes in British Columbia: Patterns and implications for conservation. Conservation Biology 9:636-644.
Calede, J. J. M., S. S. B. Hopkins, and E. B. Davis. 2011. Turnover in burrowing rodents: The roles of competition and habitat change. Palaeogeography, Palaeoclimatology, Palaeoecology 311:242–255.
Carleton, W. C., and H. S. Groucutt. 2020. Sum things are not what they seem: Problems with point-wise interpretations and quantitative analyses of proxies based on aggregated radiocarbon dates. The Holocene 31:630-643.
Converse, S. J., G. C. White, and W. M. Block. 2006. Small mammal responses to thinning and wildfire in ponderosa pine–dominated forests of the southwestern United States. Journal of Wildlife Management 70:1711-1722.
Coop, J. D., et al. 2020. Wildfire-Driven Forest Conversion in Western North American Landscapes. BioScience 70:659–673.
Craighead, A. C. H. 2000. Pellet and scat analysis as indicators of past and present habitats. Master’s thesis, Montana State University. Bozeman, U.S.A.
Culhane, K et al. 2022. Small mammal responses to fire severity mediated by vegetation characteristics and species traits. Ecology and Evolution 12:e8918.
Damuth, J. 1987. Interspecific allometry of population density in mammals and other animals: the independence of body mass and population energy-use. Biological Journal of the Linnean Society 31:193-246.
Davis, E. B. 2005. Mammalian beta diversity in the Great Basin, western USA: Palaeontological data suggest deep origin of modern macroecological structure. Global Ecology and Biogeography 14:479–490.
Dewitz, J. 2021. National Land Cover Database (NLCD) 2019 Products (ver. 3.0, February 2024) [Data set]. U.S. Geological Survey.
Donato, D. C., Harvey, B. J., and M. G. Turner. 2016. Regeneration of montane forests 24 years after the 1988 Yellowstone fires: A fire-catalyzed shift in lower treelines? Ecosphere 7:e01410.
Ejarque, A., et al. 2015. Prehistoric fires and the shaping of colonial transported landscapes in southern California: A paleoenvironmental study at Dune Pond, Santa Barbara County. Quaternary Science Reviews 112:181-196.
Emslie, S. D. and D. J. Meltzer. 2019. Late Quaternary vertebrates from the Upper Gunnison Basin, Colorado, and small-mammal community resilience to climate change since the last glacial maximum. Quaternary Research 92:388-407.
Firmage, D. S. 2019. Late Holocene climate, fire, and vegetation history of the northern Range, Yellowstone National Park. Master’s thesis, Montana State University. Bozeman, U.S.A.
Fordham, D. A., et al. 2017. PaleoView: a tool for generating continuous climate projections spanning the last 21 000 years at regional and global scales. Ecography 40:1348-1358.
Foresman, K. R. 2001. The wild mammals of Montana. Allen Press, Inc. Lawrence, USA.
Goodman, L. A. 1965. On simultaneous confidence intervals for multinomial proportions. Technometrics 7:247–254.
Grant, W. E., and E. C. Birney. 1979. Small Mammal Community Structure in North American Grasslands. Journal of Mammalogy 60:23–36.
Grayson, D. K. 1978. Minimum numbers and sample size in vertebrate faunal analysis. American Antiquity 43:53–65.
Hadly, E. A. 1996. Influence of late-Holocene climate on north- ern Rocky Mountain mammals. Quaternary Research 46:298–310.
Hadly, E. A. 1997. Evolutionary and ecological response of pocket gophers (Thomomys talpoides) to late-Holocene climatic change. Biological Journal of the Linnean Society 60:277-296.
Hadly, E. A. 1999. Fidelity of terrestrial vertebrate fossils to a modern ecosystem. Palaeogeography, Palaeoclimatology, Palaeoecology 149:389-409.
Hansen, W. D., and M. G. Turner. 2019. Origins of abrupt change? Postfire subalpine conifer regeneration declines nonlinearity with warming and drying. Ecological Monographs 89:e01340.
Hansen, W. D., et al. 2018. It takes a few to tango: changing climate and fire regimes can cause regeneration failure of two subalpine conifers. Ecology 99:966-977.
Hansen, W. D., et al. 2016. Shifting ecological filters mediate postfire expansion of seedling aspen (Populus tremuloides) in Yellowstone. Forest Ecology and Management 362:218–230.
Haslett, J., and A. Parnell. 2008. A simple monotone process with application to radiocarbon-dated depth chronologies. Journal of the Royal Statistical Society: Series C (Applied Statistics) 57:399–418.
Heeter, K. J., M. L. Rochner, and G. L. Harley. 2021. Summer air temperature for the Greater Yellowstone Ecoregion (770-2019 C.E.) over 1,250 years. Geophysical Research Letters 48:e2020GL092269.
Higuera, P. E., et al. 2009. Vegetation mediated the impacts of postglacial climatic change on fire regimes in the south-central Brooks Range, Alaska. Ecological Monographs 79:201-219.
Higuera, P., C. Whitlock, and J. Gage. 2010. Fire history and climate-fire linkages in subalpine forests of Yellowstone National Park, Wyoming, U.S.A., 1240-1975 AD. The Holocene 21:327-341.
Hill, A. P., et al. 2023. Low-elevation conifers in California’s Sierra Nevada are out of equilibrium with climate. PNAS Nexus, 2:pgad004.
Huerta, M., Whitlock, C., and J. Yale. 2009. Holocene Vegetation-Fire-Climate Linkages in northern Yellowstone National Park, USA. Palaeogeography, Palaeoclimatology, Palaeoecology 271:170-181.
Hurlbert, S. H. 1971. The nonconcept of species diversity: A critique and alternative parameters. Ecology 52:577–586.
Hurwitz, S., et al. 2020. Yellowstone’s Old Faithful Geyser shut down by a severe thirteenth century drought. Geophysical Research Letters 47:e2020GL089871.
Iglesias, V., et al. 2018. Past vegetation dynamics in the Yellowstone region highlight the vulnerability of mountain systems to climate change. Journal of Biogeography 45:1768-1780.
Johnstone, J. F. and F. S. Chapin. 2003. Non‐equilibrium succession dynamics indicate continued northern migration of lodgepole pine. Global Change Biology 9:1401–1409.
Johnstone, J. F., et al. 2010. Fire, climate change and forest resilience in interior Alaska. Canadian Journal of Forest Research 40:1302–1312.
Krause, T. R., and C. Whitlock. 2017. Climatic and non-climatic controls shaping early postglacial conifer history in the northern Greater Yellowstone Ecosystem, USA. Journal of Quaternary Science 32:1022-1036.
LANDFIRE. 2022. Existing Vegetation Type Layer, LANDFIRE 2.3.0. U.S. Department of the Interior, Geological Survey, and U.S. Department of Agriculture. Accessed 12 October 2023 at http://www.landfire/viewer.
Licciardi, J. M., and K. L. Pierce. 2018. History and dynamics of the Greater Yellowstone Glacial System during the last two glaciations, Quaternary Science Reviews 200:1-33.
Lyon, L. J., et al. 2000. Wildland fire in ecosystems: effects of fire on fauna. Page 83 in General Technical Report RMRS-GTR-42-col. 1 (Smith, J.K., ed.). U.S. Department of Agriculture, Forest Service, Rocky Mountain Research Station. Ogden, USA.
Mann, M. E., et al. 2009: Global signatures and dynamical origins of the Little Ice Age and Medieval Climate Anomaly. Science 326:1256-1260.
McHorse, B. K., Orcutt, J. D., and E. B. Davis. 2012. The carnivoran fauna of Rancho La Brea: Average or aberrant? Palaeogeography, Palaeoclimatology, Palaeoecology 329–330: 118–123.
McLean, B., and S. D Emslie. 2012. Stable isotopes reflect the ecological resilience of two high-elevation mammals from the late Quaternary of Colorado. Quaternary Research 77:408–417.
McLean, B., et al. 2014. Responses of high-elevation herbaceous plant assemblages to low glacial CO2 revealed by fossil marmot (Marmota) teeth. Oecologica 175:1117–1127.
Mead, J. I., T. W. McGinnis, and J. E. Keeley. 2006. A mid-Holocene fauna from Bear Den Cave, Sequoia National Park, California. Bulletin of the Southern California Academy of Sciences 105:43-58.
Meehl, G. A., et al. 2007. Global climate projections. Pages 747-845, in Climate Change 2007: The Physical Science Basis (Solomon, S., et al., eds.). Cambridge University Press, Cabridge, United Kingdom.
Meyer, G. A. 1995b. Late Pleistocene-Holocene evolution of the Northeastern Yellowstone Landscape. Pp. 55, in Friends of the Pleistocene Field Conference Guidebook (Meyer, G. A., ed.). Accessed 27 October 2023 at https://www.academia.edu/5446906/Meyer_Yellowstone_FOPguidebook1995.
Meyer, G. A., S. G. Wells, and A. J. T. Jull. 1995a. Fire and alluvial chronology in Yellowstone National Park: Climatic and intrinsic controls on Holocene geomorphic processes. GSA Bulletin 107:1211-1230.
Meyer, G. A., et al. 1992. Response of alluvial systems to fire and climate change in Yellowstone National Park. Nature 357:147-150.
Millspaugh, S. H., C. Whitlock, and P. J. Bartlein. 2000. Variations in fire frequency and climate over the past 17 000 yr in central Yellowstone National Park. Geology 28:211–214.
Millspaugh, S. H. 1997. Late-Glacial and Holocene variations in fire frequency in the Central Plateau and Yellowstone-Lamar provinces of Yellowstone National Park. Ph.D. dissertation, University of Oregon. Eugene, U.S.A.
Piovesan, G., et al. 2018. The oldest dated tree of Europe lives in the wild Pollino massif: Italus, a strip-bark Heldreich’s pine. Ecology 99:1682–1684.
Porder, S., A. Paytan, and E. A. Hadly. 2003. Mapping the origin of faunal assemblages using strontium isotopes. Paleobiology 29:197–204.
Power, M. J., C. Whitlock, and P. J. Bartlein. 2011. Postglacial fire, vegetation, and climate history across an elevational gradient in the northern Rocky Mountains, USA and Canada. Quaternary Science Reviews 20:2520-2533.
R Core Team. 2021. R: A language and environment for statistical computing. R Foundation for Statistical Computing, Vienna, Austria. https://www.R-project.org/.
Reimer, P. J., et al. 2020. The IntCal20 northern Hemisphere Radiocarbon Age Calibration Curve (0–55 cal kBP). Radiocarbon 62:725-757.
Romme, W. H., and D. H. Knight. 1982. Landscape diversity: the concept applied to Yellowstone Park. BioScience 32:664-670.
Romme, W. H., and D. G. Despain. 1989. Historical perspective on the Yellowstone fires of 1988. BioScience 39:695-699.
Sánchez Goñi, M. F, et al. 2017. The ACER pollen and charcoal database: a global resource to document vegetation and fire response to abrupt climate changes during the last glacial period. Earth System Science Data 9:679–695.
Savage, M., et al. 2013. Double whammy: high-severity fire and drought in ponderosa pine forests of the southwest. Canadian Journal of Forest Research 583:570–583.
Schiffer, M. B. 1986. Radiocarbon dating and the “old wood” problem: The case of the Hohokam chronology. Journal of Archaeological Science 13:13-30.
Schoennagel, T., et al. 2004. The effect of fire interval on post-fire understory communities in Yellowstone National Park. Journal of Vegetation Science 15:797-806.
Signorelli, A., et al. 2021. DescTools: Tools for descriptive statistics. R package version 0.99.41.
Smith, M. F., and J. L. Patton. 1988. Subspecies of pocket gophers: causal bases for geographic differentiation in Thomomys bottae. Systematic Biology 37:163-178.
Spaeth, P. A., et al. 2009. Phylogeography of Microtus longicaudis in the tectonically and glacially dynamic central Rocky Mountains. Journal of Mammalogy 90:571-584.
Stegner, M. A. 2016. Stasis and change in Holocene small mammal diversity during a period of aridification in southeastern Utah. The Holocene 26:1005-1019.
Stegner, M. A., et al. 2019. Post-fire vegetation and climate dynamics in low-elevation forests over the last three millennia in Yellowstone National Park. Ecography 42:1-11.
Streubel, D. 1995. Small mammals of the Yellowstone ecosystem. Robert Rinehart, Inc. Publishers. Boulder, USA.
Turner, M. G., W. H. Romme, and R. H. Gardner. 1999. Prefire heterogeneity, fire severity, and early postfire plant reestablishment in subalpine forests of Yellowstone National Park, Wyoming. International Journal of Wildland Fire 9:21-36.
Turner, M. G., et al. 1997. Effects of fire size and pattern on early succession in the Yellowstone National Park. Ecological Monographs 67:411-433.
U.S. Geological Survey. 2019. 3D Elevation Program 1-Meter Resolution Digital Elevation Model (published 20200606). Available at: https://www.usgs.gov/the-national-map-data-delivery.
Viteri, M. C., M. A. Stegner, and E. A. Hadly. 2021. Assessing the reliability of raptor pellets in recording local small mammal diversity. Quaternary Research 106:1-10.
Westerling, A. L. R. 2016. Increasing western US forest wildfire activity: sensitivity to changes in the timing of spring. Philosophical Transactions of the Royal Society B 371:20150178.
Westerling, A. L., et al. 2006. Warming and earlier spring increase Western U. S. forest wildfire activity. Science 313:940-943.
Westerling, A. L., et al. 2011. Continued warming could transform Greater Yellowstone fire regimes by mid-21st century. PNAS 108:13165-13170.
Whitlock, C., and P. J. Bartlein. 1993. Spatial variations of Holocene climatic change in the Yellowstone region. Quaternary Research 39:231–238.
Whitlock, C., et al. 2012. Holocene seasonal variability inferred from multiple proxy records from Crevice Lake, Yellowstone National Park, USA. Palaeogeograpy, Palaeoclimatology, Palaeoecology 331–332:90–103.
Whitlock, C., et al. 2008. Long-term relations among fire, fuel, and climate in the north-western US based on lake-sediment studies. International Journal of Wildland Fire 17:72-83.
Wilson, D. E., and S. Ruff. 1999. The Smithsonian Book of North American Mammals. Smithsonian Institution Press. Washington, U.S.A.
Wirth, C., et al. 2008. White spruce meets black spruce: dispersal, postfire establishment and growth in a warming climate. Ecological Monographs 78:489–505.
Wood, M. A. 1981. Small mammal communities after two recent fires in Yellowstone National Park. Master's thesis, Montana State University. Bozeman, U.S.A.
Zeveloff, S. I. 1988. Mammals of the Intermountain West. University of Utah Press. Salt Lake City, USA.
Zwolak, R. 2009. A meta-analysis of the effects of wildfire, clearcutting, and partial harvest on the abundance of North American small mammals. Forest Ecology and Management 258:539-545.
Associated editors: Marjorie Matocq and Eileen Lacey
Submitted: October 4, 2024; Reviewed: October 24, 2024
Accepted: November 13, 2024; Published on line: January 31, 2025
Supplementary material
https://mastozoologiamexicana.com/therya/index.php/THERYA/article/view/6173/1479
Figure 1. Map of the study area. A) Regional map; green border shows the Yellowstone National Park border; white triangle shows location of Waterfall Locality. B) Elevation map of the immediate vicinity of Waterfall Locality (white triangle), including streams and nearest peaks. C) Vegetation map of the immediate vicinity of Waterfall Locality. Transect a-b is represented in D), vegetation type across elevation gradient as a function of distance from point a to point b. Color scheme matches C). Elevation data are from the National Elevation Dataset at a resolution of 1/3 arcsecond (U.S. Geological Survey 2019), and vegetation cover data are from the National Land Cover Database (Dewitz 2021), both accessed using the R FedData package (Bocinsky 2024).
.png)
Figure 2. Stratigraphy of Waterfall Locality. A) Stratigraphic section of Waterfall Locality. Numbers refer to excavation units; see Supplemental 1 for detailed lithologic description. B) Photograph of the deposit during excavation.
Table 1. Waterfall Locality radiocarbon ages.
|
Lab Number |
Excavation Unit |
14C Age |
14C Error |
Material |
Calibrated YBP a |
|
CAMS-83274 |
2A |
355 |
40 |
bone |
399 (315-492) |
|
CAMS-83282 |
2A |
580 |
40 |
charcoal |
598 (529-645) |
|
CAMS-83275 |
2B |
645 |
40 |
Neotoma mandible |
604 (554-666) |
|
CAMS-83283 |
2B |
815 |
40 |
charcoal |
718 (676-794) |
|
CAMS-83276 |
6 |
1590 |
60 |
bone |
1466 (1355-1610) |
|
CAMS-83284 |
6 |
1865 |
50 |
charcoal |
1776 (1637-1908) |
|
CAMS-83277 |
8 |
2215 |
40 |
Neotoma mandible |
2225 (2115-2329) |
|
CAMS-83278 |
9 |
1645 |
45 |
Neotoma mandible |
1522 (1411-1683) |
|
CAMS-83287 |
9 |
2070 |
40 |
charcoal |
2031 (1920-2142) |
|
CAMS-83286 |
9 |
2555 |
35 |
charcoal |
2640 (2504-2746) |
|
CAMS-83285 |
9A |
1050 |
40 |
charcoal |
953 (835-1053) |
|
CAMS-83288 |
10 |
1800 |
40 |
charcoal |
1694 (1589-1812) |
|
CAMS-83279 |
10 |
2460 |
35 |
bone |
2549 (2372-2703) |
|
CAMS-83289 |
12 |
2365 |
40 |
charcoal |
2401 (2331-2665) |
|
CAMS-83280 |
13 |
2495 |
40 |
bone |
2581 (2393-2720) |
|
CAMS-83290 |
13 |
2840 |
40 |
charcoal |
2948 (2852-3095) |
|
AA-7962 |
13 |
2895 |
50 |
charcoal |
3033 (2884-3179) |
|
CAMS-83281 |
14 |
2660 |
40 |
Neotoma mandible |
2772 (2736-2850) |
|
CAMS-83291 |
14 |
3020 |
40 |
charcoal |
3219 (3079-3341) |
|
AA-7963 |
16 |
3020 |
65 |
charcoal |
3212 (3005-3362) |
|
CAMS-83292 |
16 |
39600 |
2100 |
charcoal |
43264 (40465-46256)b |
a Radiocarbon ages calibrated using the IntCal20 calibration curve (Reimer et al. 2020) in the R Bchron package (Haslett and Parnell 2008).
b Sample excluded from further analyses.
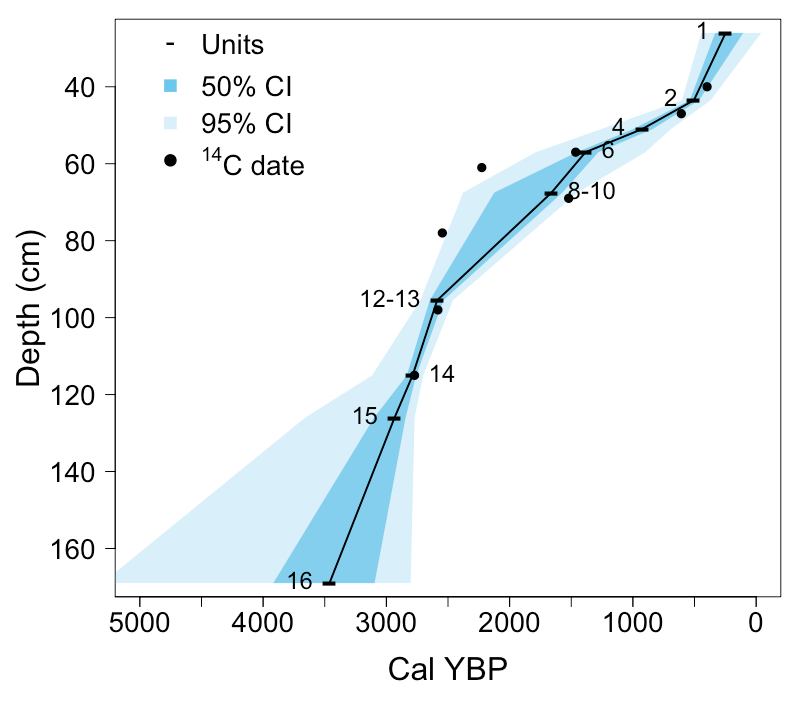
Figure 3. Bayesian age model for Waterfall Locality. Solid blue line is the median age estimate for each excavation unit; light blue shading indicates the 95 % quantiles; dark blue shading indicates the 50 % quantile; black circles show the median age estimate for the radiocarbon dates; black dashes show the mean depth for each excavation level (numbered).
Table 2. Number of Individual Specimens (NISP) and Minimum Number of Individuals (MNI) for taxa found in Waterfall Locality. Units 2A and 2B were combined to form Unit 2; Units 8 and 9 were combined to form Unit 8-9, and Units 12 and 13 were combined to form Unit 12-13. Only data from the excavation units analyzed are included here—full NISP data is available in Supplemental 2.
|
Order/Family/Genus/Species |
1 |
2 |
4 |
6 |
8-9 |
9A |
10 |
12-13 |
14 |
15 |
16 |
||
|
Carnivora |
|||||||||||||
|
Felidae |
|||||||||||||
|
Puma concolor |
1 (1) |
||||||||||||
|
Mustelidae |
|||||||||||||
|
Mustela erminea |
4 (1) |
||||||||||||
|
Mustela frenata |
1 (1) |
7 (1) |
|||||||||||
|
Neovison vison |
1 (1) |
||||||||||||
|
Artiodactyla |
1 (1) |
||||||||||||
|
Bovidae |
|||||||||||||
|
Ovis canadensis |
3 (1) |
1 (1) |
|||||||||||
|
Cervidae |
|||||||||||||
|
Cervus elaphus |
1 (1) |
1 (1) |
|||||||||||
|
Odocoileus hemionus |
1 (1) |
1 (1) |
1 (1) |
1 (1) |
|||||||||
|
Eulipotyphla |
|||||||||||||
|
Soricidae |
|||||||||||||
|
Sorex spp. |
4 (1) |
1 (1) |
3 (1) |
38 (3) |
5 (1) |
7 (1) |
14 (2) |
2 (1) |
|||||
|
Sorex (Otisorex) sp. |
4 (1) |
5 (1) |
32 (1) |
||||||||||
|
Rodentia |
|||||||||||||
|
Sciuridae |
2 (1) |
6 (1) |
1 (1) |
4 (1) |
15 (3) |
1 (1) |
1 (1) |
7 (1) |
|||||
|
Marmota flaviventris |
2 (1) |
6 (1) |
9 (1) |
5 (2) |
4 (1) |
||||||||
|
Urocitellus armatus |
21 (3) |
40 (4) |
15 (2) |
20 (3) |
87 (7) |
6 (1) |
130 (7) |
8 (2) |
2 (1) |
9 (1) |
|||
|
Callospermophilus lateralis |
10 (1) |
1 (1) |
3 (1) |
21 (3) |
5 (1) |
23 (3) |
1 (1) |
2 (2) |
|||||
|
Tamias spp. |
1 (1) |
5 (1) |
4 (1) |
13 (2) |
16 (3) |
1 (1) |
1 (1) |
6 (2) |
5 (1) |
6 (1) |
|||
|
Tamiasciurus hudsonicus |
2 (1) |
5 (1) |
1 (1) |
10 (2) |
1 (1) |
5 (1) |
18 (3) |
1 (1) |
|||||
|
Glaucomys sabrinus |
3 (1) |
1 (1) |
11 (3) |
5 (2) |
2 (1) |
1 (1) |
|||||||
|
Geomyidae |
|||||||||||||
|
Thomomys talpoides |
2 (1) |
16 (2) |
6 (2) |
5 (1) |
82 (8) |
1 (1) |
38 (5) |
9 (2) |
20 (3) |
10 (2) |
|||
|
Dipodidae |
|||||||||||||
|
Zapus princeps |
5 (2) |
12 (2) |
1 (1) |
4 (2) |
1 (1) |
||||||||
|
Cricetidae |
|||||||||||||
|
Myodes gapperi |
8 (2) |
3 (1) |
1 (1) |
11 (2) |
36 (5) |
70 (11) |
16 (3) |
26 (4) |
33 (5) |
||||
|
Microtus spp. |
26 (5) |
72 (7) |
11 (2) |
26 (5) |
82 (12) |
1 (1) |
15 (3) |
46 (6) |
14 (3) |
11 (2) |
13 (2) |
||
|
Microtus pennsylvanicus |
2 (1) |
1 (1) |
|||||||||||
|
Microtus richardsoni |
1 (1) |
3 (1) |
2 (1) |
||||||||||
|
Phenacomys intermedius |
6 (1) |
18 (4) |
3 (1) |
7 (3) |
72 (9) |
3 (1) |
24 (6) |
9 (2) |
12 (2) |
8 (1) |
|||
|
Neotoma cinerea |
14 (3) |
64 (7) |
13 (3) |
16 (3) |
84 (8) |
4 (1) |
23 (4) |
13 (2) |
25 (4) |
6 (1) |
|||
|
Peromyscus cf. P. maniculatus |
6 (2) |
12 (3) |
3 (2) |
12 (2) |
66 (14) |
1 (1) |
3 (1) |
16 (4) |
7 (2) |
5 (1) |
6 (3) |
||
|
Erethizontidae |
|||||||||||||
|
Erethizon dorsatum |
5 (1) |
||||||||||||
|
Lagomorpha |
1 (1) |
4 (1) |
7 (2) |
||||||||||
|
Leporidae |
3 (1) |
46 (3) |
5 (1) |
3 (1) |
74 (5) |
4 (1) |
2 (1) |
57 (4) |
14 (2) |
14 (2) |
1 (1) |
||
|
Lepus cf. L. americanus |
1 (1) |
1 (1) |
5 (4) |
16 (3) |
1 (1) |
1 (1) |
2 (1) |
||||||
|
Lepus sp. |
3 (2) |
3 (1) |
1 (1) |
1 (1) |
6 (1) |
||||||||
|
Sylvilagus cf. S. nuttallii |
2 (1) |
5 (3) |
1 (1) |
1 (1) |
|||||||||
|
Ochotonidae |
|||||||||||||
|
Ochotona princeps |
5 (1) |
2 (1) |
1 (1) |
||||||||||
Table 3. Richness, evenness, and sample size for each excavation unit. SQS = shareholder quorum subsampling species richness; PIE = Probability of intraspecific encounter species richness; NISP = Number of Individual Specimens.
|
Analysis Unit |
Calendar YBP [95% CI] |
Sample size (NISP) |
Richness (Raw) |
Richness (SQS) |
Evenness (PIE) [95% CI] |
|
1 |
256 [-52 – 446] |
104 |
10 |
4.01 |
0.87 [0.78 – 0.93] |
|
2 |
502 [367 – 603] |
333 |
11 |
5.94 |
0.88 [0.79 – 0.94] |
|
4 |
926 [692 – 1245] |
80 |
10 |
5.29 |
0.9 [0.83 – 0.94] |
|
6 |
1389 [879 – 1919] |
129 |
11 |
3.62 |
0.9 [0.82 – 0.94] |
|
8-9 |
1580 [1237 – 2256] |
720 |
9 |
4.39 |
0.92 [0.85 – 0.95] |
|
9A |
1627 [1380 – 2308] |
26 |
10 |
4.33 |
0.91 [0.87 – 0.93] |
|
10 |
2417 [2139 – 2585] |
36 |
10 |
5.01 |
0.78 [0.67 – 0.86] |
|
12-13 |
2594 [2455 – 2721] |
505 |
11 |
5.33 |
0.89 [0.78 – 0.94] |
|
14 |
2784 [2705 – 3036] |
109 |
8 |
3.53 |
0.9 [0.85 – 0.94] |
|
15 |
2928 [2765 – 3650] |
127 |
8 |
3.19 |
0.87 [0.79 – 0.92] |
|
16 |
3408 [2796 – 5030] |
133 |
10 |
5.77 |
0.86 [0.75 – 0.92] |
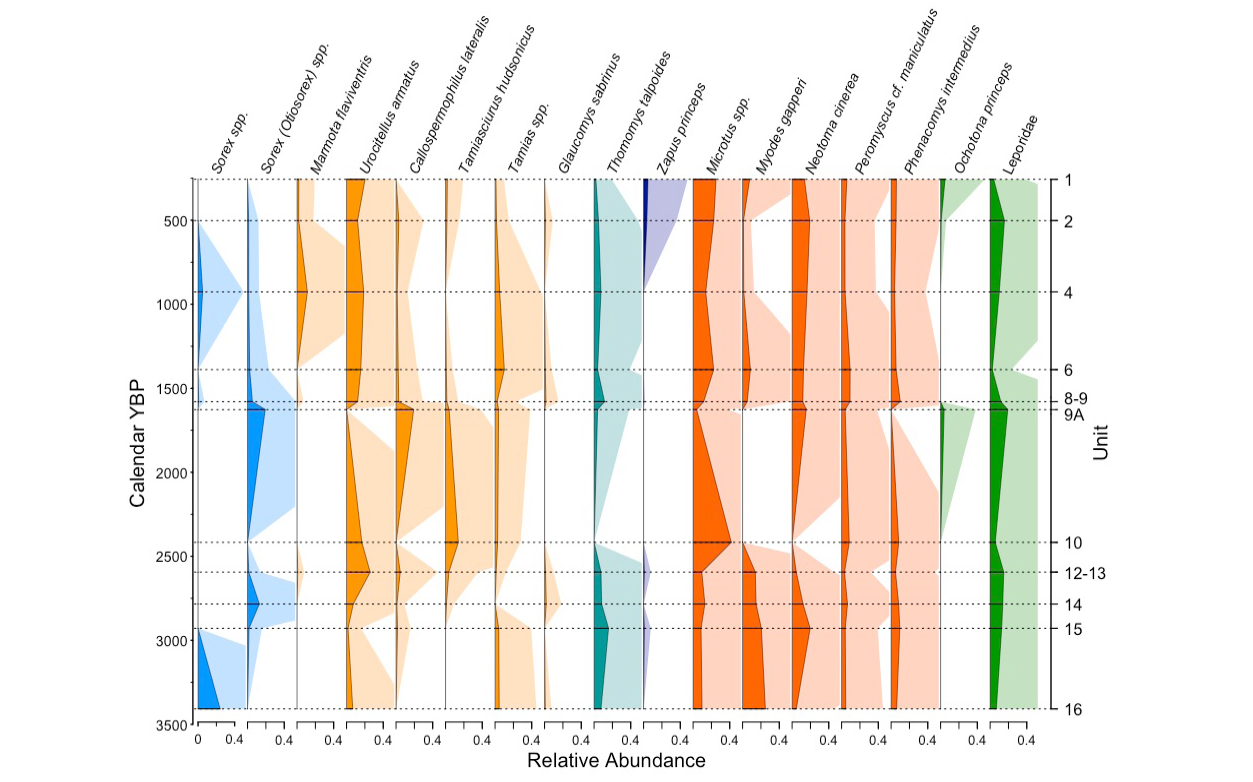
Figure 4. Waterfall Locality changes in small mammal relative abundance over time. Darker curves show relative abundance, lighter curves are an exaggeration of 8x to emphasize rare taxa. Taxa are organized by order/family: blue = Soricidae; yellow = Sciuridae; teal = Geomyidae; purple = Zapodidae; orange = Cricetidae; green = Lagomorpha.
Table 4. Mean Pearson’s product moment correlation coefficients for correlations of climate and diversity metrics. For comparisons with no value (—), the distribution of correlation coefficients was not significantly different from random, as determined by a permutation test. SQS = shareholder quorum subsampling species richness; PIE = Probability of intraspecific encounter species richness; open = relative abundance of open habitat-associated taxa; closed = relative abundance of closed habitat-associated taxa.
|
Climate Variable |
SQS |
PIE |
Open |
Closed |
|
Mean annual temperature |
-0.10 |
0.10 |
-0.10 |
-0.02 |
|
Minimum winter temperature |
— |
0.02 |
-0.11 |
0.04 |
|
Maximum summer temperature |
0.11 |
— |
0.03 |
-0.07 |
|
Temperature seasonality |
0.13 |
-0.02 |
0.10 |
-0.12 |
|
Annual precipitation |
-0.22 |
0.10 |
-0.32 |
0.16 |
|
Mean summer precipitation |
-0.17 |
-0.10 |
-0.42 |
0.37 |
|
Precipitation seasonality |
0.08 |
-0.05 |
0.04 |
-0.05 |
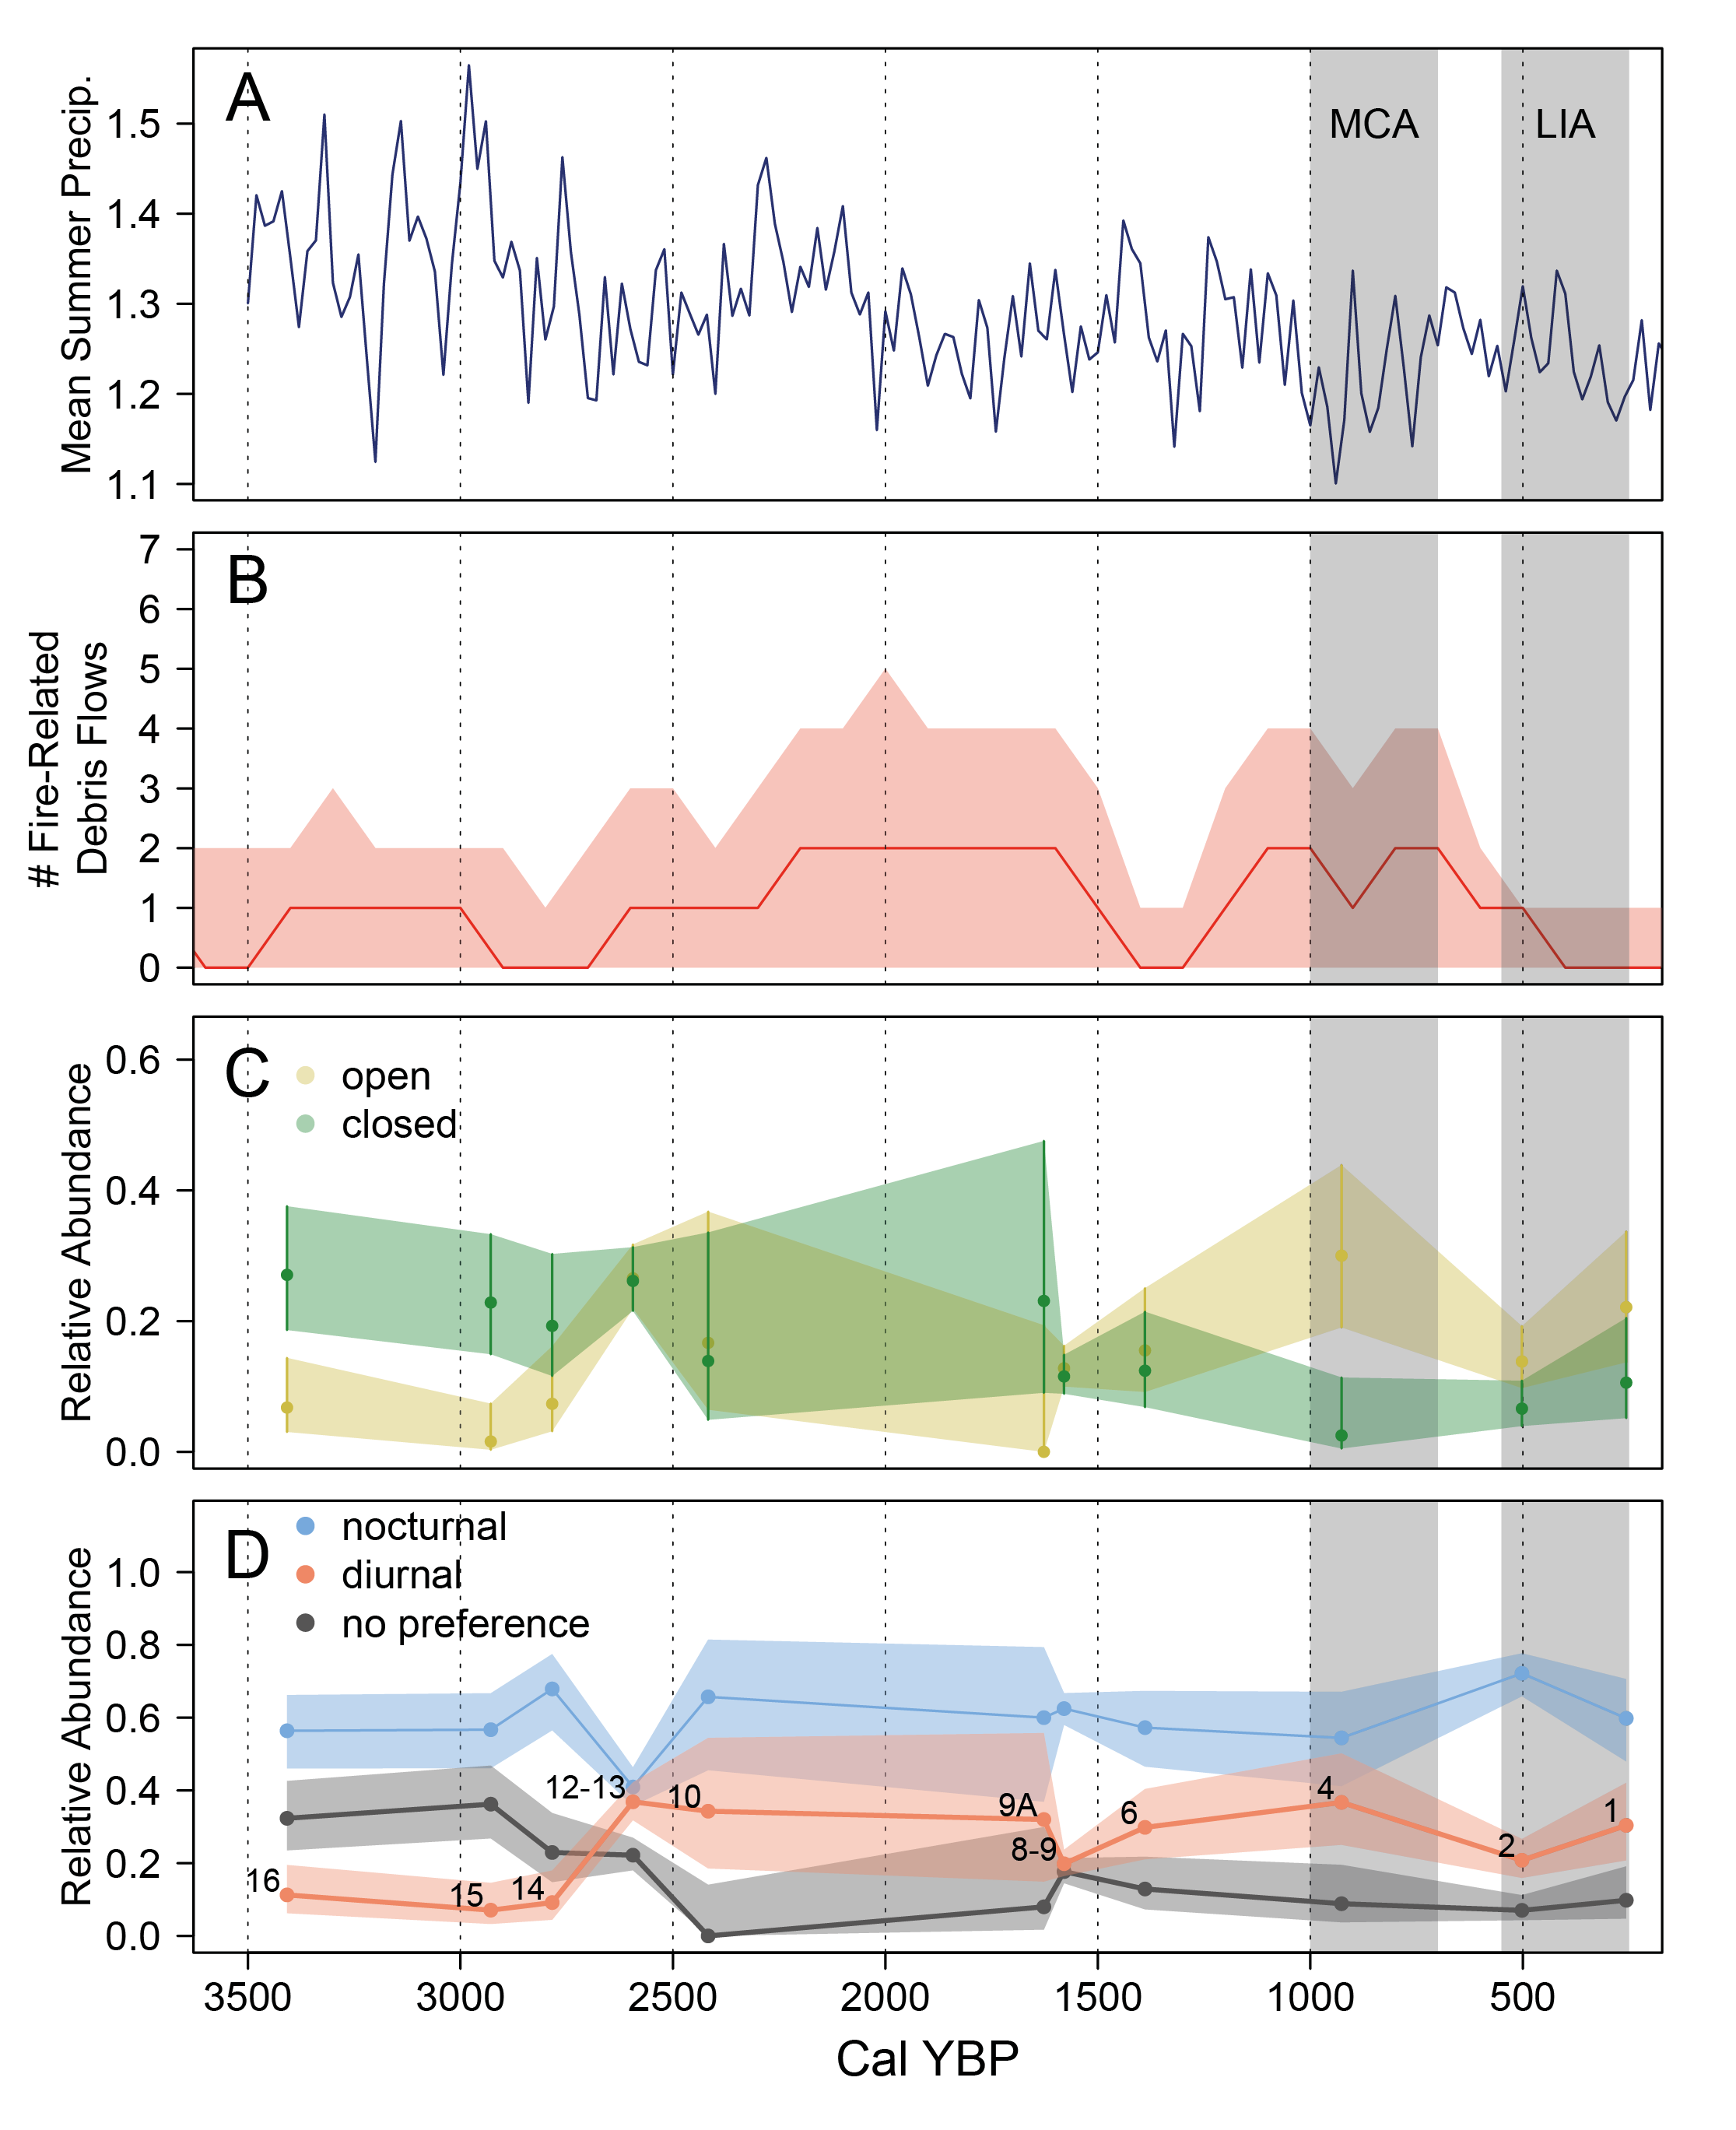
Figure 5. Precipitation, fire, and small mammal abundance change. A) Mean summer precipitation averaged over 30-year intervals at 20-year steps, for latitude 42.5 to 45.0° N, longitude 112.5 to 110.0° W, from PaleoView (Fordham et al. 2017). Vertical gray shaded areas show the approximate timing of the Medival Climate Anomaly (MCA) and Little Ice Age (LIA) based on Mann et al. (2009). B) Estimated fire-related debris flows based on average number of charcoal samples per 100 years (red line); shaded area shows the 95 % confidence interval. Relative abundance of C) open-habitat and closed-habitat taxa and D) nocturnal and diurnal taxa, and taxa with no diel preference. Solid lines and points show relative abundance; shaded polygons are Goodman’s Simultaneous Confidence Intervals. Numbers shown in D) correspond to excavation unit numbers that apply to both C and D.