THERYA, 2025, Vol. 16(1):91-106 DOI:10.12933/therya-25-6187 ISSN 2007-3364
The woodrats of California: evolution across a dynamic landscape
Marjorie D. Matocq1*, Matthew L. Holding2, Alexandra Coconis1, Jim Henderson3, W. Brian Simison3, and Kathryn M. Everson4
1 Department of Natural Resources and Environmental Science; Program in Ecology, Evolution and Conservation Biology, University of Nevada, Reno. Reno. Nevada 89509, USA. Email: acoconis@unr.edu (AC), mmatocq@unr.edu (MDM).
2 Life Sciences Institute, University of Michigan. Ann Arbor. Michigan, USA. Email: venomatt@umich.edu (MLH).
3 California Academy of Sciences. San Francisco. California, USA. Email:jhenderson@calacademy.org (JH), bsimison@calacademy.org (WBS).
4 Integrative Biology Department, Oregon State University. Corvallis. Oregon, USA. Email: eversonk@oregonstate.edu (KME).
*Corresponding author: https://orcid.org/0000-0003-4829-3749.
The dynamic landscapes of California have supported the evolution of high levels of biological diversity, including in the genus Neotoma (woodrats). Here, we use whole mitochondrial genomes and low coverage genome-wide data to explore patterns of diversity within and among five western lineages of woodrats: Neotoma fuscipes, N. macrotis, N. bryanti, N. lepida and N. cinerea. We place these patterns of diversity and differentiation within the context of what has been learned about the evolutionary dynamics of these species over the past 25 years. We end by exploring how new genomic datasets coupled with intensive fieldwork will continue to provide new insights into the evolutionary history and future trajectories of these lineages.
Los paisajes dinámicos de California han permitido la evolución de altos niveles de diversidad biológica, incluso en el género Neotoma (ratas de bosque). En este artículo, utilizamos genomas mitocondriales completos y datos de baja cobertura de todo el genoma para explorar patrones de diversidad dentro y entre cinco linajes occidentales de ratas de bosque: Neotoma fuscipes, N. macrotis, N. bryanti, N. lepida y N. cinerea. Ubicamos estos patrones de diversidad y diferenciación en el contexto de lo que se ha aprendido sobre la dinámica evolutiva de estas especies en los últimos 25 años. Terminamos explorando cómo los nuevos conjuntos de datos genómicos, junto con un trabajo de campo intensivo, seguirán brindando nuevos conocimientos sobre la historia evolutiva y las trayectorias futuras de estos linajes.
Keywords: California Floristic Province; hybridization; low coverage genomes; mitogenomes; Neotoma.
© 2025 Asociación Mexicana de Mastozoología, www.mastozoologiamexicana.org
Introduction
The landscapes of western North America have supported the evolution of diverse biotic communities. In particular, the California Floristic Province is a global biodiversity hotspot (Myers et al. 2000) and the state of California has the highest level of endemism and highest number of mammal species in the U.S. (Stein 2002). The topographic diversity of the region has created a landscape characterized by diverse climatic conditions and steep environmental gradients that have led to the diversification of both plant and animal species (Davis et al. 2008; Badgley et al. 2017).
The woodrats (genus Neotoma) of California are among many lineages that have diversified across this landscape (Goldman 1910; Hooper 1938; Matocq 2002a; Patton et al. 2007; Hornsby and Matocq 2012). Their evolutionary history provides insight into the timing and magnitude of processes that may have similarly influenced the evolution of many other taxa across western landscapes. Of the ~22 species of woodrats, five lineages are geographically well-represented in California: Neotoma fuscipes, N. macrotis, N. lepida, N. bryanti, and N. cinerea. The geographic distribution of standing genetic variation in these lineages is the result of multiple evolutionary processes operating at different spatial and temporal scales. That is, historic climate oscillations and barriers to movement determined major patterns of divergence within and among these lineages and set the stage of available regional genetic variation that we see today (Matocq 2002a; Patton et al. 2007; Hornsby and Matocq 2012). At a regional scale, current patterns of genetic variation are influenced by environmental gradients in climatic conditions and resource availability (Matocq and Murphy 2007; Shurtliff et al. 2013; Dearing et al. 2022; Nielsen et al. 2023), to which populations are continuously responding through a combination of genetic drift, phenotypic plasticity, and adaptive evolution.
Here, we begin gaining new insight into the various spatial and temporal scales of evolution in these woodrat lineages through the lens of the first whole genome datasets available for these western lineages. We generated whole mitochondrial genome sequences and low coverage resequencing of the nuclear genome from a set of populations representing each of five western lineages of woodrats. We assess support for previous work in these systems and focus on the general hierarchical distribution of genetic variation within and among these lineages, while recognizing that further insight awaits additional geographic and genomic sampling. Our initial questions include: 1) What is the timing of major lineage diversification of the western woodrat lineages?; 2) How do levels of diversity and differentiation compare between mitochondrial and genome-wide nuclear datasets?; and 3) Do we detect patterns of introgression among the western lineages? In addressing these questions, we also review what has been learned in the past ~25 years about the processes that have generated and maintained genetic variation in these lineages. We propose how genome-scale sequencing data will contribute new insights into the evolutionary history and future trajectories of these lineages.
Background: the woodrats of California. The five western species of Neotoma that we include in this analysis comprise the sister species Neotoma fuscipes and N. macrotis, and N. lepida and N. bryanti that are members of sister clades, as well as N. cinerea that may be sister to the N. fuscipes/N. macrotis clade (Matocq et al. 2007; Bradley et al. 2022), although the long branch leading to N. cinerea has made the placement of this taxon problematic (Matocq et al. 2007; Steppan and Schenk 2017).
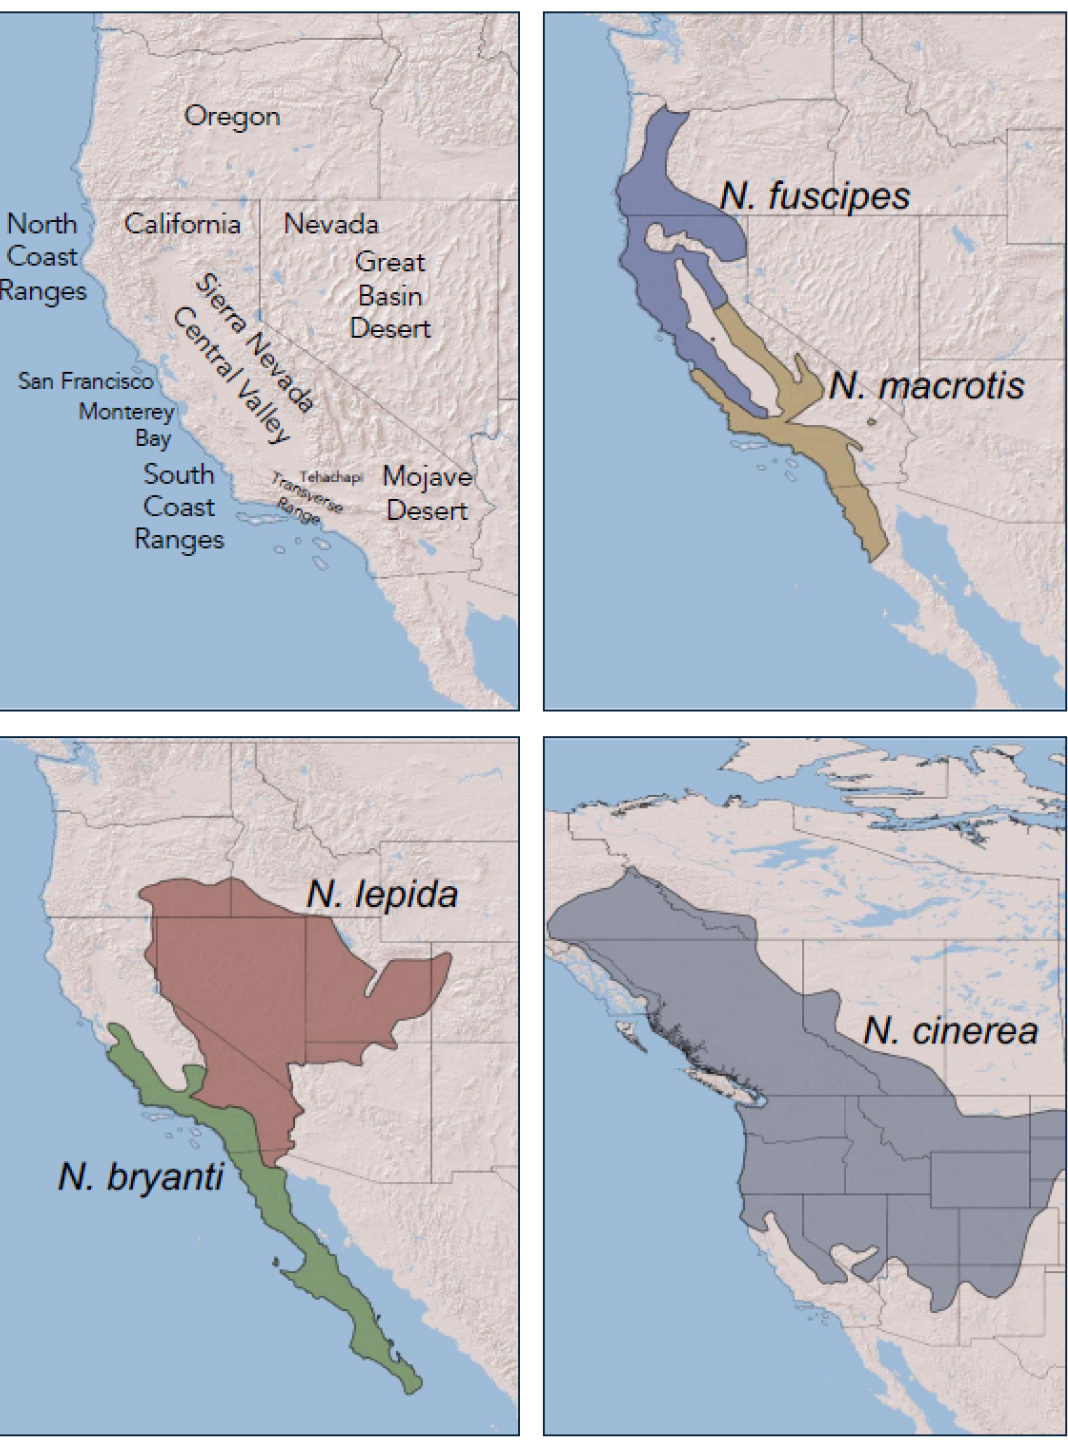
Neotoma fuscipes and N. macrotis. Neotoma fuscipes (Dusky-footed woodrat) and N. macrotis (Big-eared woodrat) are sister lineages that diverged from one another approximately two million years ago (mya; Matocq 2002a). Neotoma macrotis occupies oak and riparian woodlands with well-developed shrub understory (Linsdale and Tevis 1951; Matocq 2002a). Their range extends from Monterey Bay on the central coast of California, south along the Coast Ranges to the Sierra de San Pedro Mártir of northern Baja California, across the South Coast, Peninsular, and Transverse Ranges, north along the western foothills of the Sierra Nevada and along the eastern side of the Sierra Nevada to Bishop, California (Figure 1). Their northeastern range limit occurs near the South Fork of the American River (Matocq and Murphy 2007). One isolated population is known in the Granite Mountains of the Mojave Desert, likely a Pleistocene relict from when the species was more widespread across what is currently the Mojave Desert (Smith et al. 2000).
Neotoma fuscipes primarily occupies oak, mixed-coniferous, and juniper woodlands (Carraway and Verts 1991; Matocq 2002a). The species ranges from the Columbia River in western Oregon, south throughout much of northern California, extending along the north coast to the San Francisco Bay Area and in the foothills of the Sierra Nevada to the South Fork of the American River (Matocq and Murphy 2007). A distinct genetic lineage of N. fuscipes that Matocq (2002a) referred to as the “west central” clade extends from the San Francisco Bay Area south to the Monterey Bay and throughout the inner Coast Ranges (Boria et al. 2021). Relatively shallow mtDNA divergences within the northern clade of N. fuscipes suggest that this taxon may have only recently (re)-expanded into northern California (Matocq 2002a), yet two regionally distinct genetic groups exist across this portion of their range (Boria et al. 2021).
The ranges of N. macrotis and N. fuscipes are largely parapatric (Matocq 2002a; 2002b), but the two species hybridize when they come into contact. There is evidence of historic hybridization between the two species (Matocq et al. 2012) in a now-isolated population of woodrats in the Great Central Valley of California at Caswell Memorial State Park (see Cypher et al., this volume). Patterns of morphological character displacement in the foothills of the Sierra Nevada suggest historic contact between N. fuscipes and N. macrotis in this region (Matocq and Murphy 2007), but an active area of contact has yet to be discovered in the Sierra Nevada. A zone of secondary contact and active hybridization between the two species exists south of Monterey Bay, California along the Nacimiento River on the Camp Roberts Military Reservation (Coyner et al. 2015; Hunter et al. 2017; Matocq et al. 2024).
Neotoma lepida and N. bryanti. Neotoma lepida (Desert woodrat) and N. bryanti (Bryant’s woodrat) are part of two sister clades that diverged from one another approximately 1.6 mya (Patton et al. 2007). Neotoma lepida primarily occupies desert shrubland habitats, including those dominated by creosote bush and yucca in the Mojave Desert to Juniper and Sagebrush-dominated habitats in the Great Basin Desert (Figure 1). The species is found throughout the lower elevations of the Mojave and Great Basin Deserts and is often replaced by N. cinerea at mid and higher elevations throughout the Great Basin (Coconis et al. 2024).
Neotoma bryanti occupies similar arid habitats to N. lepida in the eastern and southern portions of its range, and coast scrub habitats in the western portion of its range. Both species utilize rock and boulder structures when available, but both can also build free-standing houses. Neotoma bryanti ranges from the San Francisco Bay south along the coastal and inner Coast Ranges through northern Baja California, across the Transverse ranges and into the southern foothills of the Sierra Nevada (Figure 1).
The ranges of N. lepida and N. bryanti are parapatric with two known areas of active hybridization (Patton et al. 2007): one in the Kelso Valley of the western Mojave Desert (Shurtliff et al. 2014; Jahner et al. 2021; Nielsen et al. 2023) and the other in the Morongo Valley of southern California (Klure et al. 2023). Historic hybridization between the two species has led to a pattern of mitonuclear discordance wherein nuclear and morphological N. bryanti of the southern Sierra Nevada, Tehachapi Mountains, and western Mojave Desert possess a N. lepida-like mitochondrial type (Patton et al. 2007).
Neotoma cinerea. Neotoma cinerea (the bushy-tailed woodrat) is the largest and most cold-tolerant species of Neotoma. Its distribution spans a broad latitudinal range that extends from northern New Mexico and Arizona to the arctic regions of Canada (Figure 1). The species primarily occupies montane woodland habitats and builds large middens within cliffs, caves and rock outcrops. The species is characterized by five mitochondrial subclades, several of which show signatures of post-glacial expansion, including the clade sampled herein (INT, Hornsby and Matocq 2012) that is currently found throughout the northern Sierra Nevada and the Great Basin Desert.
The morphological distinction of N. cinerea from other woodrats resulted in its early placement in its own genus/subgenus Teonoma (Goldman 1910; Burt and Barkalow 1942), but later morphological analyses (Carleton 1980) suggested a close relationship between N. cinerea and N. fuscipes. Subsequent molecular analyses (Edwards and Bradley 2002; Matocq et al. 2007) have, likewise, shown contrasting results concerning the placement of N. cinerea within Neotoma.
Materials and methods
Sample collection. We collected woodrats representing five species from the following sites (Figure 2; Appendix 1): N. cinerea (Cline Buttes, OR, N = 2; Valley Falls, OR, N = 5; Stead, NV, N = 4); N. fuscipes (Weed, CA, N = 4; Likely, CA, N = 3; Pilot Hill, CA, N = 4; Soquel, CA, N = 4); N. macrotis (Arroyo Seco, CA, N = 4; Erskine Creek, CA, N = 3; Lake Isabella, CA, N = 4; Hungry Valley, CA, N = 4; Caspers Wilderness Park, CA, N = 4); N. lepida (Stead, NV, N = 4; Lake Isabella, CA, N = 4); N. bryanti (Hungry Valley, CA, N = 3). For the mitogenome analysis we also included samples previously collected by J. L. Patton of N. bryanti (Crocker Grade, CA, N = 4; Joaquin Flats, CA, N = 4; Porterville, CA, N = 3) and N. lepida (Halloran Spring, CA, N = 4; Pisgah Lava Flow, CA, N = 4). While some sample locations for N. cinerea and N. lepida occur outside of California, the sampled clades are those that occur in California. Additional specimen and locality data are provided in Appendix 1. All new collections were done in accordance with permits issued by the California Department of Fish and Wildlife, Oregon Game and Fish, and the Nevada Department of Wildlife as well as oversight of the University of Nevada, Reno Institutional Animal Care and Use Committee.
Sequencing and variant calling. From the newly collected specimens, we extracted high quality DNA from liver tissue using the DNeasy Blood and Tissue Kit (Qiagen, Germany) according to manufacturer instructions. From the previously collected specimens, we used DNA extractions originally generated by and reported in Patton et al. (2007) and loaned to us by the Museum of Vertebrate Zoology. The quantity of the extracted DNA was measured with a Qubit 2.0 Fluorometer (Invitrogen, USA). DNA quality and fragment size distribution was assessed using 1% agarose gel electrophoresis. When necessary, DNA was sheared using a Covaris M220 ultrasonicator (Covaris Inc., USA). Libraries were constructed using the NEBNext® Ultra™ II DNA Library Preparation Kit (New England Biolabs Inc., USA) according to manufacturer instructions. Final libraries had an average insert size of 300 to 400 bp.
Libraries were sequenced by Novogene on an Illumina Novaseq S4 to generate paired-end 2x150 bp sequence data. We removed adapters and quality filtered and trimmed raw DNA sequence reads using the software fastp (Chen et al. 2018). We produced a pseudo-chromosomal reference genome by using the program RagTag v2.1 (Alonge et al. 2022) to combine the trio-binned, scaffold-scale Neotoma bryanti reference genome (https://osf.io/xck3n/; Greenhalgh et al. 2022) into chromosome length scaffolds based on the unpublished Neotoma fuscipes reference genome (Holding et al., forthcoming). We aligned short reads to this reference with BWA-MEM (Li 2013) and piped outputs directly to elPrep for sorting, duplicate marking, and read group replacement using the elPrep filter function (Herzeel et al. 2015). This step ensured efficient processing and standardization of the BAM files for downstream analyses. Read group information for each bam file was derived from the input FASTQ files to maintain sample integrity and traceability.
Variant calling was performed using bcftools (Li 2011). First, bcftools mpileup was executed with the parameters -Ou, -B, -C 50, -a QS, AD, and DP to output uncompressed variant data and annotate quality metrics. The mpileup results were input to bcftools call using the -mv and -Oz options for variant calling. The raw VCF file was then filtered using vcftools with minimum depth of four, a maximum depth of 30, a minimum allele frequency of 0.017, a minimum base quality of 30, and a minimum missing variants of 80 %.
Mitogenomes. Whole mitochondrial genomes were extracted from our raw sequencing reads via a custom pipeline. We first used BLAST+ (v.2.9) to query the R1 files from our paired-end read set against the NCBI “mito” database available at https://ftp.ncbi.nlm.nih.gov/blast/db. We retained the top hit for each query, then used the R1 and matching R2 reads for each hit as input to the program metaSPAdes (Nurk et al. 2017). The mitochondrial genome was not recovered for one N. macrotis individual from Lake Isabella (UNR 4133); for all other individuals, the longest record in the metaspades.scaffolds.fasta output file corresponded to the full mitochondrial genome. Because the mitochondrial genome is circular, the fasta sequences had to be re-flowed to start and end in the same genomic location before they could be aligned. We re-flowed all sequences to start at tRNA-Phe, which is canonical for Vertebrata, using an internally developed script (https://github.com/calacademy-research/assembly_etc/tree/main/categories/mito). We augmented our dataset using whole mitochondrial genomes previously published on GenBank from three ingroup species (N. albigula: NC_068809; N. magister: NC_039670; and N. mexicana: KY707300) and six outgroups: Onychomys leucogaster (NC_029760), Peromyscus californicus (OP524493), P. leucogaster (NC_037180), P. leucopus (NC_037180), P. maniculatus (NC_039921), and Reithrodontomys mexicanus (NC_035597). All mitochondrial genomes were aligned using MAFFT v7 (Katoh and Standley 2013).
Mitochondrial phylogeny and divergence time estimation. We conducted a Bayesian phylogenetic analysis in BEAST v2.7.4 (Bouckaert et al. 2014) to reconstruct evolutionary relationships and estimate divergence times from our mitochondrial data. Each coding region in the alignment was treated as a separate partition, and substitution models were estimated for each partition during the analysis using bModelTest (Bouckaert and Drummond 2017); non-coding regions were excluded. To calibrate the root of the tree, we applied a log-normal prior with a hard minimum age of 9.2 million years and a soft maximum (M = 2.0, S = 1.0). This calibration was based on the species Paronychomys†, which is an extinct member of the subfamily Neotominae known from fossil deposits that are at least 9.2 million years old (Whistler and Burbank 1992; Kelly and Martin 2022). We then employed an Optimized Relaxed Clock model (Drummond et al. 2006) with broad priors applied to branch rates (ORCRates log-normal prior; M = 1, S = 0.5) and branch rate variation (ORCsigma exponential prior; mean = 0.333) to accommodate rate variation among lineages. The clock rate prior (ORCucldMean) followed a log-normal distribution (M = 3.0, S = 0.5), with the mean value being roughly informed by counting the mean pairwise substitutions between ingroup and outgroup species in the dataset and assuming an approximate root age of 10 million years. Bayesian analyses were performed in four independent runs of 100 million generations each, sampling every 5,000 generations. Convergence and mixing were assessed using Tracer v1.7.2 (Rambaut et al. 2018), with effective sample size values exceeding 200 used as the threshold for reliable parameter estimates. Two of the runs were excluded due to poor mixing and convergence. We combined the log and tree files from the remaining two runs (200 generations total) using LogCombiner (Drummond and Rambaut 2007), applying a burn-in of 20 % to each file. The maximum clade credibility tree with common ancestor node heights was generated from the combined tree file using TreeAnnotator (Drummond and Rambaut 2007) and was visualized using FigTree v1.4.4 (http://tree.bio.ed.ac.uk/software/figtree/).
Nuclear phylogeny and divergence estimation. We estimated a maximum-likelihood phylogeny from our nuclear dataset using the program IQ-Tree v.2.2.2.7 (Minh et al. 2020). As input, we converted our filtered VCF file (see above) to phylip format using the python script vcf2phylip (https://github.com/edgardomortiz/vcf2phylip). We then used the GTR+ASC substitution model, which applies ascertainment bias correction (Lewis 2001) to SNP data, and obtained branch supports using ultrafast bootstrapping (Hoang et al. 2018) with 1000 replicates. The final tree was visualized using FigTree v1.4.4.
We computed a matrix of pairwise p-distances among all individuals in our mitochondrial dataset using the function “dist.dna” (model = “raw”) in the R package ape (Paradis and Schliep 2019). We also calculated a matrix of p-distances from the nuclear SNP dataset using the command “Dset” (Distance = P) in PAUP*v.4.0a (Swofford 2003). For both matrices, mean p-distances within and among populations were calculated using Excel (Microsoft Corporation).
Estimates of introgression. We used two approaches to detect admixture among the lineages examined herein. We did not include populations close to known areas of active hybridization in this analysis, so we did not anticipate finding hybrid individuals. Nonetheless, we use both population and phylogenetic approaches to identify potential historic admixture between the lineages. To explore population and lineage subdivision in the nuclear dataset, we utilized ANGSD (htslib version 1.17; Korneliussen et al. 2014) and NGSAdmix (Skotte et al. 2013) as implemented in the ANGSD package. In ANGSD, we generated genotype likelihoods for each individual, then used NGSadmix to explore genetic subdivision across the dataset by examining a range of possible genetic clusters (K) ranging from 1 to 12. To determine support for each value of K we used the method described by Evanno et al. (2005), as implemented in Clumpak (Cluster Markov Packager Across K; Kopelman et al. 2015).
To identify historic introgression among the lineages, we used a phylogenetic network approach implemented in the PhyloNet package (Than et al. 2008; Wen et al. 2018). This approach recognizes that a simple model of lineage bifurcation cannot fully capture the process of evolutionary divergence, especially among closely related lineages that are likely to be characterized by incomplete lineage sorting and introgression. We used 10,000 randomly subsampled biallelic SNPs from our filtered VCF file and restricted this dataset to include only one individual per lineage (the individual with the lowest amount of missing data) to reduce computational burden. We explored different maximum numbers of reticulations (MR = 0, 1, and 2) using the MCMC_Bimarkers algorithm (Zhu and Nakhleh 2018; Zhu et al. 2018). In each analysis, we used a Markov Chain Monte Carlo (MCMC) with 500,000 generations, sampling every 500 generations after a 200,000 generation burn-in. The “varytheta” flag was used to account for potential differences in population size among the lineages. After running each model (MR = 0-2), we plotted the maximum a posteriori (MAP) score of the best supported network and selected the model that resulted in a sharp improvement in MAP. The best supported network was then visualized using IcyTree (Vaughan 2017).
Results
Mitogenome relationships and divergence timing. The final mitochondrial dataset included 86 individuals and had a total aligned length of 17,734 base pairs (bp). Our phylogenetic reconstruction based on full mitogenomes provides strong support for relationships across the depth of divergences pertinent to the lineages examined here with the majority of nodes supported by Bayesian posterior probabilities >0.95 (Figure 2, 3 ingroup taxa; Supp. Figure 1, full taxon set). The analysis strongly places N. cinerea outside of the remainder of Neotoma, as represented by N. albigula, N. magister, N. mexicana, N. fuscipes, N. macrotis, N. lepida, and N. bryanti. As expected, N. albigula and N. magister are more closely related to one another than to N. mexicana, consistent with previous analyses (Edwards and Bradley 2002; Matocq et al. 2012; Bradley et al. 2022). Within the five focal species, several well-supported clades are evident but with minimal geographic structure. Within N. fuscipes, there is strong support for a west central clade (represented by the locality Soquel) and a northern clade represented by the localities Pilot Hill, Weed, and Likely, consistent with earlier recognition of this subdivision with N. fuscipes (Matocq 2002a). We also recover a distinct subclade of N. lepida-like mitochondria in the Porterville population of N. bryanti, as expected from the ancient mitochondrial capture discovered by Patton et al. (2007) in this population and surrounding region.
Our analysis places the base of divergence of Neotoma at approximately 4.7 mya (median common ancestor height = 4.71 mya, 95 % CI: 4.27 to 5.29 mya) and the base of the 4 focal lineages N. fuscipes, N. macrotis, N. bryanti, and N. lepida at approximately 3.5 mya (median 3.53 mya, 95% CI: 3.18 – 3.97 mya; Figure 3). The subdivision of N. fuscipes and N. macrotis is estimated to have occurred 2.23 mya (95 % CI: 1.99 to 2.53 mya), followed by subdivision of the clades that include N. bryanti and N. lepida 1.63 mya (95 % CI: 1.43 to 1.86 mya), and then subdivision of the northern and west central clades of N. fuscipes 1.45 mya (95 % CI: 1.27 to 1.67 mya). The haplotypes we sampled within N. cinerea, N. macrotis, and N. bryanti began diverging in the range of 420 to 490 kya, while the individual lineages within N. fuscipes and N. lepida appear to have diversified more recently (60, 90, and 180 kya).
Across the mitogenome, average uncorrected pairwise sequence divergences within lineages represented by more than one population ranged from 0.4 % in the northern lineage of N. fuscipes to 1.1 % in N. cinerea (Table 1). The two lineages of N. fuscipes differ from one another by 6.3 % mitochondrial sequence divergence. Neotoma macrotis differs from the two lineages of N. fuscipes by approximately 8.0 to 8.2 %, while N. bryanti and N. lepida differ from one another by approximately 6.9 %. On average, N. macrotis-N. fuscipes differ from N. bryanti-N. lepida by 10.6 to 11.0 %, and these lineages each differ from N. cinerea by over 12 %. The distinct subclade of N. lepida-like mitochondria in the Porterville population of N. bryanti is approximately 1 % divergent from other N. lepida mitochondria.
Nuclear phylogeny, diversity and differentiation. The final filtered VCF file contained a total of 342,297 variant sites for 56 individuals, which was used in all downstream analyses. The nuclear phylogenetic analysis (Figure 4) yielded strong support for the relationships among the individuals and taxa for which nuclear genome-wide data was available. In comparison to the mitogenome tree, the nuclear data more consistently recovered locality-specific subclades. Consistent with the mitogenome analysis, we recovered well-differentiated west central and northern clades of N. fuscipes. Within the northern clade of N. fuscipes, the central Sierran population of Pilot Hill clusters separately from the more northerly set of populations, Likely and Weed.
Across the nuclear genome, average uncorrected pairwise sequence divergences within lineages represented by more than one population ranged from 0.6 % in the northern lineage of N. fuscipes, N. lepida and N. cinerea to 1.3 % in N. macrotis (Table 1). The two lineages of N. fuscipes differ from one another by 5 % nuclear sequence divergence. Neotoma macrotis differs from the northern lineage of N. fuscipes by approximately 7 % while differing from the west central lineage by 6 %. Neotoma bryanti and N. lepida differ across the nuclear genome by approximately 6.5 % . On average, N. macrotis-N. fuscipes differ from N. bryanti-N. lepida by 12.1 to 13.7 %, and these lineages each differ from N. cinerea by 17.0 to 18.2 %.
Admixture and introgression. The NGSAdmix analysis showed that the nuclear dataset was most consistent with K = 5 and K = 7, but we show K = 3 to 7 because we find the progression of subdivision informative (Figure 5). At K = 3 we find the expected distinction of N. cinerea from an N. fuscipes-N. macrotis group and an N. lepida-N. bryanti group. At K = 4, N. fuscipes and N. macrotis become distinct, and interestingly, the Soquel population (representing west central N. fuscipes) appears to be admixed between N. fuscipes and N. macrotis. At K = 5, we see the distinction of the Soquel population of N. fuscipes (the most supported solution), at K = 6 we see a poorly supported solution with subdivision within N. cinerea, and at K = 7 we see the distinction of N. bryanti from N. lepida (the second most supported solution).
Using PhyloNet, we tested whether a phylogenetic network (allowing for reticulation) offered a better fit to our data compared to a traditional bifurcating tree. We tested models with a maximum of 0, 1, or 2 reticulations (MR = 0 to 2) and found a significant improvement in model MAP scores at MR = 1 (Posterior ESS = 174; Figure 6). The network topology suggests a sister relationship between N. cinerea and the N. macrotis-N. fuscipes clade, but with ancestral introgression between the ancestors of N. macrotis-N. fuscipes and the ancestors of N. lepida-N. bryanti (inheritance probability γ = 0.47).
Discussion
The woodrats of California occupy a wide range of native habitats and their diversification through time provides insight into the evolutionary processes that have led to the accumulation and retention of biodiversity across these landscapes. We use genome-wide data to gain insight into patterns of diversity at various spatial scales to establish a baseline from which to conduct further analyses to identify processes that generate and maintain diversity across space and time in this system.
Mitochondrial relationships in western Neotoma. Evolutionary relationships within Neotoma and its allies have been examined using morphological characters, and both mitochondrial and nuclear markers (reviewed in Edwards and Bradley 2002; Matocq et al. 2007; and Bradley et al. 2022). All recent molecular analyses are consistent with the sister relationship between N. fuscipes and N. macrotis, and of the close relationship between N. lepida and N. bryanti (Patton et al. 2007; Matocq et al. 2007; Bradley et al. 2022). Likewise, the representative other lineages of woodrats included here – N. albigula, N. magister and N. mexicana – consistently group outside the lineage that contains N. fuscipes, N. macrotis, N. lepida and N. bryanti. Nonetheless, one of the outstanding questions with regards to the western woodrat lineages examined here is the placement of N. cinerea. As previously mentioned, the morphological distinction of N. cinerea resulted in this species being placed in its own genus/subgenus Teonoma (Goldman 1910; Burt and Barkalow 1942), but later morphological analyses (Carleton 1980) suggested a closer relationship with N. fuscipes. The distinction of N. cinerea is also reflected in molecular data and the fact that N. cinerea is characterized by a “long branch” of evolutionary change, a particularly difficult problem when using parsimony analysis (Felsenstein 1978). Matocq et al.’s (2007) parsimony analysis of two mitochondrial and 4 nuclear loci weakly placed N. cinerea as sister to the rest of Neotoma, consistent with previous work by Edwards and Bradley (2002) based on cytochrome-b sequence data. However, Matocq et al.’s (2007) Bayesian analysis placed N. cinerea within Neotoma, as sister to the clade containing N. macrotis and N. fuscipes. The most recent and comprehensive analysis of Neotoma and its close allies based on Bayesian analysis of five nuclear loci and four mitochondrial genes found strong support that N. cinerea belongs within the clade containing N. macrotis, N. fuscipes, N. lepida, and N. bryanti (Bradley et al. 2022).
Our Bayesian analysis of the full mitogenome of select representatives of Neotoma again places N. cinerea outside the remainder of Neotoma. Because a nested position for N. cinerea is recovered in past analyses that have included both nuclear and mitochondrial loci (e. g., Matocq et al. 2007 and Bradley et al. 2022) as well as in our phylogenetic network analysis of genome-wide nuclear data, it seems clear that the mitochondrial history of N. cinerea is distinct from that recorded by its nuclear genome. One possible cause of this discrepancy is that the long branch of evolutionary divergence that characterizes the mtDNA of N. cinerea may be due to higher rates of mitochondrial evolution, perhaps in part due to selection (Ballard and Rand 2005). The cold climates occupied by N. cinerea may pose unique physiological challenges that have imposed selection on the mitochondrial genome to meet the energetic demands of low or fluctuating temperature environments (Breton et al. 2021). Mitochondria play a central role in oxidative phosphorylation and thermogenesis (Cannon and Nedergaard 2004) and specific mtDNA haplotypes have been shown to be associated with higher thermogenesis in mammals (Fontanillas et al. 2005). Further geographic and genomic sampling across the large climatic gradient occupied by N. cinerea is needed to provide the basis from which to gain insight into the history of environmental selection and adaptive evolution in this lineage.
Timing and geographic context of divergence in western lineages of Neotoma. According to our mitogenome analysis, the first major diversification in the clade that includes N. macrotis, N. fuscipes, N. lepida, and N. bryanti occurred 3.5 mya during the Pliocene (which spanned ~5 to 2.5 mya). The fossil record is not adequately detailed to provide insight into where the major divergence occurred that led to the ancestors of N. macrotis-N. fuscipes and the clades containing N. lepida and N. bryanti. However, this divergence likely occurred at a time depth when major landscape changes were still occurring, especially across southern California, such as the continued uplift of the Transverse Range, Tehachapi Mountains, and Peninsular Range, and major water embayments along the southern coast of California and northern Baja California, including an inundated southern Central Valley (Hall 2002; Jacobs et al. 2004; Peryam et al. 2011). Such major landscape changes likely contributed to early isolation and differentiation of the ancestors of the modern lineages.
Patton et al. (2007) proposed that the two lineages containing N. bryanti and N. lepida, respectively, diverged from one another approximately 1.6 mya (highly consistent with our full mitogenome estimate of 1.63 mya) in southern California as a result of reduced connectivity across the floodplain habitats of the Pliocene Bouse lake/embayment (their figure 146). For N. fuscipes and N. macrotis, Matocq (2002a; 2002b) proposed that the species diverged due to north-south separation by glacial rivers along the central Sierra Nevada, approximately 2 mya, which our full mitogenome estimate pushes to 2.23 mya. To reconcile the timing and proposed spatial position of these more recent divergences with the deeper divergence that led to these lineages (3.5 mya), we propose that the geologically active region of the western Transverse Range and Tehachapi Mountains may have been the site of initial divergence. That is, the ancestors of N. fuscipes-N. macrotis-N. bryanti-N. lepida could have been broadly distributed across this portion of southern California during the climatic optimum of the early Pliocene (4.5 to 3.5 mya), but when these warmer conditions were replaced by cooler and more variable conditions (Peryam et al. 2011), distributional shifts could have been coupled with lineage differentiation. Specifically, under cooler and more variable conditions, the ancestors of N. lepida-N. bryanti would have partly retreated south and further diversified across the modified habitats of the previous Bouse lake/embayment. The ancestors of the more northern lineage, N. fuscipes-N. macrotis, would have meanwhile primarily occupied areas north of the Transverse-Tehachapi region and experienced subsequent differentiation due to water and glacial barriers in the Central Valley and Sierran foothills, including the differentiation of the northern and west central clades of N. fuscipes (1.45 mya). We note that this geographic scenario could easily encompass N. cinerea as part of the early divergence of this western clade of woodrats by adding a lineage that largely expanded east and north.
The hypothesis that the Transverse-Tehachapi region would have played a role in the early divergence of the western lineages of woodrats is consistent with the known role of this region in generating and maintaining biodiversity (Davis et al. 2008). It is likely that the sharp elevational relief of this region has amplified climatic fluctuations through time (Badgley et al. 2017) and created repeated pulses of isolation among populations that retreated into nearby lowlands. In fact, even within Neotoma macrotis, we find relatively shallow, but spatially distinct lineages that come into contact in the Transverse-Tehachapi region; a pattern consistent in both the mitochondrial and nuclear datasets. One lineage appears to extend along the southern Coast Ranges to the western portion of the Transverse-Tehachapi region (localities Arroyo Seco and Hungry Valley), while the other extends from the southern Sierra Nevada and Tehachapi Mountains (Lake Isabella and Erskine Creek) into southern California (Caspers Wilderness Park), with the mitogenome data showing haplotype sharing in the Hungry Valley locality in the Transverse-Tehachapi region. These subclades are spatially consistent with those documented by Matocq (2002a). Overall, the Transverse-Tehachapi region is well known as a site of biogeographic subdivision and confluence among species/lineages with more western/northern distributions and those with more southern/eastern distributions (reviewed in Gottscho 2016). The confluence (and perhaps repeated confluence) of closely related lineages across this region may have contributed to further ecological divergence, but also allowed genetic admixture (Davis et al. 2008); both processes contributing to high levels of diversity, and both being clearly reflected at various evolutionary depths in the woodrats of this region.
Hybridization in the history of western Neotoma. As each species of woodrat has continued to expand (and perhaps re-expand) into their current distributions, one evolutionary phenomenon that has repeatedly occurred is hybridization between each set of closely related lineages when they come into secondary contact. Throughout California, there are multiple examples of recent and ongoing hybridization between N. lepida and N. bryanti, as well as between N. fuscipes and N. macrotis (detailed below). Moreover, our phylogenetic network analysis suggests ancient hybridization at deeper evolutionary timescales. The phylogenetic network showed support for the placement of N. cinerea as sister to the clade containing N. fuscipes and N. macrotis, but that this topology requires inference of introgression between the ancestors of N. fuscipes-N. macrotis and those of N. lepida-N. bryanti. While these results are preliminary, they serve as a reminder that the propensity of these animals to interbreed is unlikely to be restricted to the modern lineages and that ancient introgression events should be considered in our reconstruction of woodrat evolutionary history.
Neotoma bryanti and N. lepida. The most impressive example of historic hybridization has led to a pattern of mitonuclear mismatch that extends throughout the southern Sierra Nevada and Tehachapi Mountains (Patton et al. 2007), again demonstrating the importance of this region in the history of western woodrat lineages. After their initial divergence, the current mtDNA diversity in N. bryanti suggests that they expanded north approximately 0.5 mya (Figure 3; Patton et al. 2007). Neotoma lepida likely expanded north more recently; 0.3 to 0.4 mya according to Patton et al. (2007) and 0.13 to 0.18 mya in the small geographic extent we sampled here, and depending on whether we include the N. bryanti-captured clade (Figure 3). Once the lineages met during their northern expansion, likely in the vicinity of the Transverse-Tehachapi region, they hybridized (female N. lepida and male N. bryanti) which led to descendants with purely N. bryanti nuclear genomes and a N. lepida-like mtDNA. Interestingly, while active hybridization between N. bryanti and N. lepida occurs nearby in the west Mojave Desert (Patton et al. 2007; Shurtliff et al. 2014; Jahner et al. 2021; Nielsen et al. 2021 and 2023), laboratory mate choice trials suggest that most modern interspecific pairings are likely between N. bryanti females and N. lepida males (Shurtliff et al. 2013). Nonetheless, even if the reciprocal cross is relatively rare, this rare event clearly had a profound evolutionary consequence. The current pattern of spatial mitonuclear mismatch is consistent with multiple demographic scenarios (Patton et al. 2007), however, the spread and maintenance of this novel recombinant type under any scenario would have been facilitated if it were favored by selection. Whether the novel N. lepida-like mtDNA could impart a physiological advantage over the N. bryanti mitochondrial type remains to be investigated (K. Everson, forthcoming).
Neotoma fuscipes and N. macrotis. Historic hybridization and mitochondrial capture has also been documented between N. fuscipes and N. macrotis. Such admixed ancestry characterizes the animals that occupy Caswell Memorial State Park and nearby locations (Matocq et al. 2012). In these now isolated populations, both N. fuscipes and N. macrotis mitochondrial types co-occur, and at least based on nuclear microsatellite analysis, the nuclear genomes appear to be of admixed ancestry between the two species (Matocq et al. 2012). Although such known admixed populations were not included in our analysis here, we were intrigued to see that at K = 4, just prior to the west central clade of N. fuscipes (represented by Soquel) emerging as a distinct genetic unit at K = 5 (purple set, Figure 5), that the Soquel individuals appeared partially admixed between N. fuscipes and N. macrotis. Although preliminary, these results may suggest that interspecific hybridization that led to the admixed population(s) in the Central Valley may not be restricted to that region alone and may extend to the eastern and western flanks of the valley perhaps from a time when east-west habitat continuity was much greater across this region (reviewed in Matocq et al. 2012).
Ongoing hybridization between N. macrotis and N. fuscipes occurs where their ranges meet in the southern Coast Ranges along the Nacimiento River south of Monterey Bay (Coyner et al. 2015; Hunter et al. 2017; Matocq et al. 2024). During a five-year period, the center of the hybrid zone shifted in part due to the small-bodied N. macrotis having a survival advantage over the larger-bodied N. fuscipes in years with dry winters (Hunter et al. 2017). This survival advantage coupled with dispersal of N. macrotis into the range previously dominated by N. fuscipes led to augmented interspecific mating opportunities and an increase in admixture over time (Matocq et al. 2024). This system will continue to provide novel insight into the important link between weather/climate fluctuations and rates of hybridization and the potential for interspecific gene flow.
Mechanisms contributing to species boundaries. Patterns of hybridization between N. fuscipes and N. macrotis, as well as between N. lepida and N. bryanti suggest that both pre- and post-zygotic isolating mechanisms impact realized gene flow between these lineages. The site of secondary contact and hybridization between N. lepida and N. bryanti at Whitney Well in the west Mojave Desert is characterized by a sharp ecotone that helps maintain fine-scale parapatry between the two species creating a pre-zygotic filter to gene flow due to relatively infrequent interspecific mating opportunities (Shurtliff et al. 2014; Nielsen et al. 2021, 2023). Such an ecological filter to hybridization, though, does not occur at another site of hybridization between these two lineages (Klure et al. 2023) nor is there an obvious ecological component to the active hybrid zone between N. macrotis and N. fuscipes (Coyner et al. 2015). In both pairs of taxa, when interspecific mating opportunities arise, body size (and perhaps associated levels of aggression) appears to play a role in mating decisions, where females of the smaller-bodied congener (N. macrotis and N. lepida) rarely choose to mate with males of the larger-bodied species (N. fuscipes and N. bryanti, respectively; Shurtliff et al. 2013; Matocq et al. 2024). As such, in both systems, the generation of F1s is asymmetric in terms of who serves as the mother species and father species, yet genomic patterns clearly show that backcrossing occurs in both parental directions, which would allow for introgression between the parental species (Shurtliff et al. 2014; Coyner et al. 2015). Nonetheless, both study systems also show evidence of genomic incompatibilities. Specifically, based on genome-wide patterns of variation (N. lepida and N. bryanti, Jahner et al. 2021) and field-measured reproductive success (N. fuscipes and N. macrotis, Matocq et al. 2024), the vast majority of admixed individuals have at least one pure parent, that is, they are the result of backcrossing. This suggests that the genomic stability of admixed individuals requires at least one full parental complement of the genome. Further evidence of genomic incompatibility comes from the N. fuscipes/N. macrotis hybrid zone where F1 males sire very few young, consistent with Haldane’s Rule (Haldane 1922). Finally, while we know that each species pair differ in male genital morphology (Matocq 2002b; Patton et al. 2007; Matocq et al. 2012), the role of possible genital “mismatch” in fertilization efficiency has yet to be quantified in woodrats. In sum, these woodrat systems provide ample opportunity to continue investigating the role of behavior, morphology, ecology, and genetics in determining the nature of species boundaries and the potential of hybridization and introgression to influence the evolutionary trajectory of these lineages.
Future directions. We are clearly in the earliest stages of our exploration of genome-wide datasets in these lineages, but we see great promise in our ability to address fundamental ecological and evolutionary questions in new ways with such datasets. As genome-wide data continue to become available in these species and across the genus Neotoma, we will gain further insight into the timing of important divergence events. Perhaps more importantly, we will gain insight into how different parts of these genomes responded in distinct ways to neutral and selective processes as these species experienced changing environmental conditions through time. These augmented datasets coupled with advances in demographic modeling will provide insight into how these lineages have expanded and contracted across these landscapes and how they have interacted with their environments and each other in the process.
The availability of active hybrid zones between these lineages provides unique laboratories in which to further understand the mechanisms that underlie the causes and consequences of hybridization, including the adaptive leaps that may be possible when a species can “shop” in the genome of a closely related but differentially adapted species. Detailed field studies coupled with thorough genomic sequencing will allow unprecedented insight into the early stages of introgression and how, essentially, one genome is filtered against the background of another through recombination and selection. We are especially interested to follow this process for the parts of the genome that we already know play a significant role in ecological adaptation for these species, including those involved in detoxification (Dearing et al. 2005; Greenhalgh et al. 2024). We expect that detoxification loci are under strong selection in this system as evidenced by massive expansion of certain detoxification gene families (Greenhalgh et al. 2022; Holding et al. forthcoming). Identifying the functional significance and evolution of structural variation in these and other gene families will require integration of functional assays with an understanding of how this variation is distributed from individual genomes to a landscape scale that encompasses the environmental variation these species experience. What we know for certain is that the most important discoveries yet to be made in this system and others will come from thorough integration of field and genetic studies conducted across multiple temporal and spatial scales—the hallmark of Jim Patton’s approach to studying mammalian evolution.
Acknowledgements
For assistance in the field, field data management, and specimen preparation we thank D. Moore, J. Wurtz, S. Zipkin, and D. Nielsen. We thank Athena Lam for assistance in the lab and C. Adkins for assistance in creating distribution maps. Samples were generously shared by the Museum of Vertebrate Zoology, U.C. Berkeley. This project was supported in part by the National Science Foundation (OIA-1827209).
To Jim and Carol from MM: Thank you for introducing me to woodrats. You both brought me to the Hastings Reservation to trap my first ones. Little did I know then that these fascinating critters would become the focus of my career. Jim, your invitation to join the MVZ family was the basis of every opportunity that has come to me since. You believed in me long before I believed in myself, and that made all the difference. Throughout my career, your and Carol’s kindness and nurturing have been among the most special parts of my life. I take great pleasure in thinking about all the discoveries we still have to make and share - so let’s get to work!
Literature cited
Alonge, M., et al. 2022. Automated assembly scaffolding using RagTag elevates a new tomato system for high-throughput genome editing. Genome Biology 23:258.
Badgley, C., T., et al. 2017. Biodiversity and topographic complexity: modern and geohistorical perspectives. Trends in Ecology and Evolution 32:211–226.
Ballard, J. W. O., and D. M. Rand. 2005. The population biology of mitochondrial DNA and its phylogenetic implications. Annual Review of Ecology, Evolution and Systematics 36:621–642.
Boria, R. A., et al. 2021. Genome-wide genetic variation coupled with demographic and ecological niche modeling of the dusky-footed woodrat (Neotoma fuscipes) reveal patterns of deep divergence and widespread Holocene expansion across northern California. Heredity 126:521–536.
Bouckaert, R., et al. 2014 . BEAST 2: A software platform for Bayesian evolutionary analysis. PLOS Computational Biology 10:e1003537.
Bouckaert, R. R., and A. J. Drummond. 2017. bModelTest: Bayesian phylogenetic site model averaging and model comparison. BMC Evolutionary Biology 17:42.
Bradley, R. D., et al. 2022. Reevaluation of the phylogenetic relationships among Neotomini rodents (Hodomys, Neotoma , and Xenomys) and comments on the woodrat classification. Journal of Mammalogy 103:1221–1236.
Breton, S., F. Ghiselli, and L. Milani. 2021. Mitochondrial short-term plastic responses and long-term evolutionary dynamics in animal species. Genome Biology and Evolution 13:evab084.
Burt, W. H., and F. S. Barkalow. 1942. A comparative study of the bacula of wood rats (subfamily Neotominae). Journal of Mammalogy 23:287–297.
Cannon, B., and J. Nedergaard. 2004. Brown adipose tissue: function and physiological significance. Physiological Reviews 84:277–359.
Carleton, M. D. 1980. Phylogenetic relationships in neotomine-peromyscine rodents (Muriodea) and a reappraisal of the dichotomy within New World Cricetinae. Miscellaneous Publications Museum of Zoology, University of Michigan 157:1–146.
Carraway, L. N., and B. J. Verts. 1991. Neotoma fuscipes. Mammalian Species 386:1-10.
Chen, S., et al. 2018. fastp: an ultra-fast all-in-one FASTQ preprocessor. Bioinformatics 34:i884–i890.
Coconis, A., et al. 2024 . The role of climate and species interactions in determining the distribution of two elevationally segregated species of small mammals through time. Ecography, in press. https://doi.org/10.5061/dryad.mpg4f4r8q.
Coyner, B. S., P. J. Murphy, and M. D. Matocq. 2015. Hybridization and asymmetric introgression across a narrow zone of contact between Neotoma fuscipes and N. macrotis (Rodentia: Cricetidae). Biological Journal of the Linnean Society London 115:162–172.
Davis, E. B., et al. 2008. The California Hotspots Project: identifying regions of rapid diversification of mammals. Molecular Ecology 17:120–138.
Dearing, M. D., W. J. Foley, and S. McLean. 2005. The influence of plant secondary metabolites on the nutritional ecology of herbivorous terrestrial vertebrates. Annual Review of Ecology, Evolution and Systematics 36:169–189.
Dearing, M. D., et al. 2022. Toxin tolerance across landscapes: Ecological exposure not a prerequisite. Functional Ecology 36:2119–2131.
Drummond, A. J., et al. 2006. Relaxed phylogenetics and dating with confidence. PLOS Biology 4:e88.
Drummond, A. J., and A. Rambaut. 2007. BEAST: Bayesian evolutionary analysis by sampling trees. BMC Evolutionary Biology 7:214.
Edwards, C. W., and R. D. Bradley. 2002. Molecular systematics of the genus Neotoma. Molecular Phylogenetics and Evolution 25:489–500.
Evanno, G., S. Regnaut, and J. Goudet. 2005 . Detecting the number of clusters of individuals using the software STRUCTURE: a simulation study. Molecular Ecology 14:2611–2620.
Felsenstein, J. 1978. Cases in which parsimony or compatibility methods will be positively misleading. Systematic Zoology 27:401–410.
Fontanillas, P., et al. 2005. Nonshivering thermogenesis capacity associated to mitochondrial DNA haplotypes and gender in the greater white-toothed shrew, Crocidura russula. Molecular Ecology 14:661–670.
Goldman, E. A. 1910. Revision of the woodrats of the genus Neotoma. North American Fauna 31:1-124.
Gottscho, A. D. 2016. Zoogeography of the San Andreas Fault system: Great Pacific Fracture Zones correspond with spatially concordant phylogeographic boundaries in western North America. Biological Reviews 91:235–254.
Greenhalgh, R., et al. 2022. Trio-binned genomes of the woodrats Neotoma bryanti and Neotoma lepida reveal novel gene islands and rapid copy number evolution of xenobiotic metabolizing genes. Molecular Ecology Resources 22:2713–2731.
Greenhalgh, R., et al. 2024. The desert woodrat (Neotoma lepida) induces a diversity of biotransformation genes in response to creosote bush resin. Comparative Biochemistry and Physiology Part C: Toxicology and Pharmacology 280:109870.
Haldane, J. B. S. 1922. Sex ratio and unisexual sterility in hybrid animals. Journal of Genetics 12:101–109.
Hall, C. A. 2002. Nearshore marine paleoclimatic regions, increasing zoogeographic provinciality, molluscan extinctions, and paleoshorelines, California: late Oligocene (27 Ma) to late Pliocene (2.5 Ma). Geological Society of America 357.
Herzeel, C., et al. 2015. elPrep: High-performance preparation of sequence alignment/map files for variant calling. PLOS One 10:e0132868.
Hoang, D. T., et al. 2018. UFBoot2: improving the ultrafast bootstrap approximation. Molecular Biology and Evolution 35:518–522.
Hooper, E. T. 1938. Geographical variation in wood rats of the species Neotoma fuscipes. University of California Publications in Zoology 42:213–246.
Hornsby, A. D., and M. D. Matocq. 2012. Differential regional response of the bushy-tailed woodrat (Neotoma cinerea) to late Quaternary climate change. Journal of Biogeography 39:289–305.
Hunter, E. A., et al. 2017. Differential effects of climate on survival rates drive hybrid zone movement. Current Biology 27:3898-3903.e4.
Jacobs, D. K., T. A. Haney, and K. D. Louie. 2004. Genes, diversity, and geologic process on the pacific coast. Annual Review of Earth and Planetary Sciences 32:601–652.
Jahner, J. P., T. L. Parchman, and M. D. Matocq. 2021. Multigenerational backcrossing and introgression between two woodrat species at an abrupt ecological transition. Molecular Ecology 30:4245–4258.
Katoh, K., and D. M. Standley. 2013. MAFFT multiple sequence alignment software version 7: Improvements in performance and usability. Molecular Biology and Evolution 30:772–780.
Kelly, T. S., and R. A. Martin. 2022. Phylogenetic positions of Paronychomys Jacobs and Basirepomys Korth and De Blieux relative to the tribe Neotomini (Rodentia, Cricetidae). Journal of Paleontology 96:692–705.
Klure, D. M., et al. 2023. Hybridization in the absence of an ecotone favors hybrid success in woodrats (Neotoma spp.). Evolution 77:959–970.
Kopelman, N. M., et al. 2015. Clumpak: a program for identifying clustering modes and packaging population structure inferences across K. Molecular Ecology Resources 15:1179–1191.
Korneliussen, T. S., A. Albrechtsen, and R. Nielsen. 2014. ANGSD: analysis of next generation sequencing data. BMC Bioinformatics 15:356.
Lewis, P. O. 2001. A likelihood approach to estimating phylogeny from discrete morphological character data. Systematic Biology 50:913–925.
Li, H. 2011. A statistical framework for SNP calling, mutation discovery, association mapping and population genetical parameter estimation from sequencing data. Bioinformatics 27:2987–2993.
Li, H. 2013. Aligning sequence reads, clone sequences and assembly contigs with BWA-MEM. arXiv https://doi.org/10.48550/arXiv.1303.3997
Linsdale, J. M., and L. P. Tevis. 1951. The Dusky-Footed Wood Rat: A record of observations made on the Hastings Natural History Reservation. University of California Press.
Matocq, M. D. 2002a. Phylogeographical structure and regional history of the dusky-footed woodrat, Neotoma fuscipes. Molecular Ecology 11:229–242.
Matocq, M. D. 2002b. Morphological and molecular analysis of a contact zone in the Neotoma fuscipes species complex. Journal of Mammalogy 83:866-883.
Matocq, M. D., et al. 2024. Asymmetric mate preference and reproductive interference mediate climate-induced changes in mate availability in a small mammal hybrid zone. Evolution 78:1818-1830.
Matocq, M. D., et al. 2012. Reconstructing the evolutionary history of an endangered subspecies across the changing landscape of the Great Central Valley of California. Molecular Ecology 21:5918–5933.
Matocq, M. D., and P. J. Murphy. 2007. Fine-scale phenotypic change across a species transition zone in the genus Neotoma: disentangling independent evolution from phylogenetic history. Evolution 61:2544–2557.
Matocq, M. D., Q. R. Shurtliff, and C. R. Feldman. 2007. Phylogenetics of the woodrat genus Neotoma (Rodentia: Muridae): Implications for the evolution of phenotypic variation in male external genitalia. Molecular Phylogenetics and Evolution 42:637–652.
Minh, B. Q., et al. 2020. IQ-TREE 2: New models and efficient methods for phylogenetic inference in the genomic era. Molecular Biology and Evolution 37:1530–1534.
Myers, N., et al. 2000. Biodiversity hotspots for conservation priorities. Nature 403:853–858.
Nielsen, D. P., et al. 2023. The gut microbiome reflects ancestry despite dietary shifts across a hybrid zone. Ecology Letters 26:63–75.
Nielsen, D. P., and M. D. Matocq. 2021. Differences in dietary composition and preference maintained despite gene flow across a woodrat hybrid zone. Ecology and Evolution 11:4909–4919.
Nurk, S., et al. 2017. metaSPAdes: a new versatile metagenomic assembler. Genome Research 27:824–834.
Paradis, E., and K. Schliep. 2019. Ape 5.0: an environment for modern phylogenetics and evolutionary analyses in R. Bioinformatics 35:526–528.
Patton, J. L., D. G. Huckaby, and S. T. Álvarez-Castañeda. 2007. The evolutionary history and a systematic revision of woodrats of the Neotoma lepida group. University of California Press, Berkeley, USA.
Peryam, T. C., R. J. Dorsey, and I. Bindeman. 2011. Plio-Pleistocene climate change and timing of Peninsular Ranges uplift in southern California: Evidence from paleosols and stable isotopes in the Fish Creek–Vallecito basin. Palaeogeography, Palaeoclimatology, Palaeoecology 305:65–74.
Rambaut, A., et al. 2018. Posterior summarization in Bayesian phylogenetics using Tracer 1.7. Systematic Biology 67:901–904.
Shurtliff, Q. R., P. J. Murphy, and M. D. Matocq. 2014. Ecological segregation in a small mammal hybrid zone: habitat-specific mating opportunities and selection against hybrids restrict gene flow on a fine spatial scale. Evolution 68:729–742.
Shurtliff, Q. R., et al. 2013. Experimental evidence for asymmetric mate preference and aggression: behavioral interactions in a woodrat (Neotoma) hybrid zone. BMC Evolutionary Biology 13:220.
Skotte, L., T. S. Korneliussen, and A. Albrechtsen. 2013. Estimating individual admixture proportions from next generation sequencing data. Genetics 195:693–702.
Smith, F. A., M. D. Matocq, K. F. Melendez, A. M. Ditto 1, and P. A. Kelly. 2000. How isolated are Pleistocene refugia? Results from a study on a relict woodrat population from the Mojave Desert, California. Journal of Biogeography 27:483–500.
Stein, B. A. 2002. States of the Union: ranking America’s biodiversity. Arlington, Virginia: NatureServe.
Steppan, S. J., and J. J. Schenk. 2017. Muroid rodent phylogenetics: 900-species tree reveals increasing diversification rates. PLOS One 12:e0183070.
Swofford, D. L. 2003. PAUP*. Phylogenetic analysis using parsimony (* and other methods). Version 4. Sinauer Associates, Sunderland, Massachusetts.
Than, C., D. Ruths, and L. Nakhleh. 2008. PhyloNet: a software package for analyzing and reconstructing reticulate evolutionary relationships. BMC Bioinformatics 9:322.
Vaughan, T. G. 2017. IcyTree: Rapid browser-based visualization for phylogenetic trees and networks. Bioinformatics 33:2392-2394.
Wen, D., Y. Yu, J. Zhu, and L. Nakhleh. 2018. Inferring phylogenetic networks using PhyloNet. Systematic Biology 67:735-740.
Whistler, D. P., and D. W. Burbank. 1992. Miocene biostratigraphy and biochronology of the Dove Spring Formation, Mojave Desert, California, and characterization of the Clarendonian mammal age (late Miocene) in California. GSA Bulletin 104:644–658.
Zhu, J., and L. Nakhleh. 2018. Inference of species phylogenies from bi-allelic markers using pseudo-likelihood. Bioinformatics 34:i376-i385.
Zhu, J., et al. 2018. Bayesian inference of phylogenetic networks from bi-allelic genetic markers. PLOS Computational Biology 14:e1005932.
Associated editor: Sergio Ticul Álvarez-Castañeda
Submitted: November 24, 2024; Reviewed: December 1, 2024
Accepted: January 21, 2025; Published on line: January 31, 2025
Appendix 1
Specimens included in this study. UNR = University of Nevada, Reno; MVZ = Museum of Vertebrate Zoology.
|
Species |
Specimen No. |
DNA ID |
Site name |
County |
State |
Latitude |
Longitude |
|
N. bryanti |
UNR 4175 |
GG18 |
Hungry Valley SRA |
Ventura |
CA |
34.74479 |
-118.86694 |
|
N. bryanti |
UNR 4178 |
GG21 |
Hungry Valley SRA |
Ventura |
CA |
34.73934 |
-118.89086 |
|
N. bryanti |
UNR 4179 |
GG22 |
Hungry Valley SRA |
Ventura |
CA |
34.73827 |
-118.89222 |
|
N. bryanti |
MVZ 195975 |
- |
Crocker Grade |
San Luis Obispo |
CA |
35.2 |
-119.7 |
|
N. bryanti |
MVZ 195976 |
- |
Crocker Grade |
San Luis Obispo |
CA |
35.2 |
-119.7 |
|
N. bryanti |
MVZ 195979 |
- |
Crocker Grade |
San Luis Obispo |
CA |
35.2 |
-119.7 |
|
N. bryanti |
MVZ 195980 |
- |
Crocker Grade |
San Luis Obispo |
CA |
35.2 |
-119.7 |
|
N. bryanti |
MVZ 196822 |
- |
Joaquin Flat |
Kern |
CA |
35.02651 |
-118.69642 |
|
N. bryanti |
MVZ 196823 |
- |
Joaquin Flat |
Kern |
CA |
35.02651 |
-118.69642 |
|
N. bryanti |
MVZ 196827 |
- |
Joaquin Flat |
Kern |
CA |
35.02651 |
-118.69642 |
|
N. bryanti |
MVZ 198594 |
- |
Joaquin Flat |
Kern |
CA |
35.02651 |
-118.69642 |
|
N. bryanti |
MVZ 196074 |
- |
Porterville |
Tulare |
CA |
35.89183 |
-118.91687 |
|
N. bryanti |
MVZ 196075 |
- |
Porterville |
Tulare |
CA |
35.89183 |
-118.91687 |
|
N. bryanti |
MVZ 196076 |
- |
Porterville |
Tulare |
CA |
35.89183 |
-118.91687 |
|
N. cinerea |
UNR 4124 |
GG23 |
Cline Buttes |
Deschutes |
OR |
44.25344 |
-121.27355 |
|
N. cinerea |
UNR 4125 |
GG24 |
Cline Buttes |
Deschutes |
OR |
44.24828 |
-121.27860 |
|
N. cinerea |
UNR 4140 |
GG17 |
Stead Archery Range |
Washoe |
NV |
39.70629 |
-119.82730 |
|
N. cinerea |
UNR 4139 |
GG31 |
Stead Archery Range |
Washoe |
NV |
39.70662 |
-119.82594 |
|
N. cinerea |
UNR 4145 |
GG32 |
Stead Archery Range |
Washoe |
NV |
39.70662 |
-119.82594 |
|
N. cinerea |
UNR 4134 |
GG33 |
Stead Archery Range |
Washoe |
NV |
39.70656 |
-119.82590 |
|
N. cinerea |
UNR 4136 |
GG39 |
Valley Falls |
Lake |
OR |
42.48959 |
-120.35621 |
|
N. cinerea |
UNR 4135 |
GG40 |
Valley Falls |
Lake |
OR |
42.49357 |
-120.35792 |
|
N. cinerea |
UNR 4127 |
GG41 |
Valley Falls |
Lake |
OR |
42.48955 |
-120.35680 |
|
N. cinerea |
UNR 4126 |
GG42 |
Valley Falls |
Lake |
OR |
42.50789 |
-120.34636 |
|
N. cinerea |
UNR 4128 |
GG43 |
Valley Falls |
Lake |
OR |
42.50769 |
-120.34607 |
|
N. fuscipes |
UNR 4131 |
GG35 |
Likely |
Modoc |
CA |
41.21723 |
-120.47828 |
|
N. fuscipes |
UNR 4132 |
GG36 |
Likely |
Modoc |
CA |
41.22589 |
-120.44794 |
|
N. fuscipes |
UNR 4130 |
GG37 |
Likely |
Modoc |
CA |
41.22701 |
-120.44466 |
|
N. fuscipes |
UNR 4137 |
GG2 |
Pilot Hill |
El Dorado |
CA |
38.82865 |
-120.99421 |
|
N. fuscipes |
UNR 4138 |
GG3 |
Pilot Hill |
El Dorado |
CA |
38.82891 |
-120.99425 |
|
N. fuscipes |
UNR 4276 |
GG29 |
Pilot Hill |
El Dorado |
CA |
38.82915 |
-120.99461 |
|
N. fuscipes |
UNR 4277 |
GG30 |
Pilot Hill |
El Dorado |
CA |
38.82889 |
-120.99493 |
|
N. fuscipes |
UNR 4162 |
GG4 |
Soquel |
Santa Cruz |
CA |
37.07701 |
-121.93135 |
|
N. fuscipes |
UNR 4163 |
GG5 |
Soquel |
Santa Cruz |
CA |
37.07732 |
-121.93193 |
|
N. fuscipes |
UNR 4164 |
GG6 |
Soquel |
Santa Cruz |
CA |
37.07755 |
-121.92817 |
|
N. fuscipes |
UNR 4165 |
GG7 |
Soquel |
Santa Cruz |
CA |
37.08698 |
-121.93285 |
|
N. fuscipes |
UNR 4144 |
GG44 |
Weed |
Siskiyou |
CA |
41.53488 |
-122.24864 |
|
N. fuscipes |
UNR 4143 |
GG45 |
Weed |
Siskiyou |
CA |
41.53424 |
-122.24792 |
|
N. fuscipes |
UNR 4141 |
GG46 |
Weed |
Siskiyou |
CA |
41.53463 |
-122.24852 |
|
N. fuscipes |
UNR 4142 |
GG47 |
Weed |
Siskiyou |
CA |
41.53414 |
-122.24788 |
|
N. lepida |
UNR 4123 |
GG48 |
Lake Isabella |
Kern |
CA |
35.64538 |
-118.21299 |
|
N. lepida |
UNR 4120 |
GG50 |
Lake Isabella |
Kern |
CA |
35.59020 |
-118.23845 |
|
N. lepida |
UNR 4117 |
GG51 |
Lake Isabella |
Kern |
CA |
35.76450 |
-118.08729 |
|
N. lepida |
UNR 4115 |
GG57 |
Lake Isabella |
Kern |
CA |
35.76403 |
-118.08239 |
|
N. lepida |
UNR 4271 |
GG1 |
Stead Archery Range |
Washoe |
NV |
39.70629 |
-119.82964 |
|
N. lepida |
UNR 4270 |
GG34 |
Stead Archery Range |
Washoe |
NV |
39.70519 |
-119.83002 |
|
N. lepida |
UNR 4119 |
GG59 |
Stead Archery Range |
Washoe |
NV |
39.70572 |
-119.82931 |
|
N. lepida |
UNR 4129 |
GG60 |
Stead Archery Range |
Washoe |
NV |
39.70501 |
-119.83032 |
|
N. lepida |
MVZ 215584 |
- |
Halloran Spring |
San Bernardino |
CA |
39.40230 |
-115.89977 |
|
N. lepida |
MVZ 215585 |
- |
Halloran Spring |
San Bernardino |
CA |
39.40230 |
-115.89977 |
|
N. lepida |
MVZ 215586 |
- |
Halloran Spring |
San Bernardino |
CA |
39.40230 |
-115.89977 |
|
N. lepida |
MVZ 215588 |
- |
Halloran Spring |
San Bernardino |
CA |
39.40230 |
-115.89977 |
|
N. lepida |
MVZ 215603 |
- |
Pisgah Lava Flow |
San Bernardino |
CA |
34.74704 |
-116.34514 |
|
N. lepida |
MVZ 215605 |
- |
Pisgah Lava Flow |
San Bernardino |
CA |
34.74704 |
-116.34514 |
|
N. lepida |
MVZ 215607 |
- |
Pisgah Lava Flow |
San Bernardino |
CA |
34.74704 |
-116.34514 |
|
N. lepida |
MVZ 215608 |
- |
Pisgah Lava Flow |
San Bernardino |
CA |
34.74704 |
-116.34514 |
|
N. macrotis |
UNR 4272 |
GG25 |
Arroyo Seco |
Monterey |
CA |
36.23306 |
-121.48155 |
|
N. macrotis |
UNR 4273 |
GG26 |
Arroyo Seco |
Monterey |
CA |
36.41572 |
-121.32047 |
|
N. macrotis |
UNR 4274 |
GG27 |
Arroyo Seco |
Monterey |
CA |
36.23420 |
-121.48046 |
|
N. macrotis |
UNR 4275 |
GG28 |
Arroyo Seco |
Monterey |
CA |
36.23445 |
-121.48061 |
|
N. macrotis |
UNR 4169 |
GG10 |
Caspers Wldr. Park |
Orange |
CA |
33.54062 |
-117.55787 |
|
N. macrotis |
UNR 4167 |
GG11 |
Caspers Wldr. Park |
Orange |
CA |
33.55135 |
-117.56711 |
|
N. macrotis |
UNR 4166 |
GG8 |
Caspers Wldr. Park |
Orange |
CA |
33.54383 |
-117.55883 |
|
N. macrotis |
UNR 4168 |
GG9 |
Caspers Wldr. Park |
Orange |
CA |
33.54062 |
-117.55789 |
|
N. macrotis |
UNR 4172 |
GG14 |
Erskine Creek |
Kern |
CA |
35.57532 |
-118.41425 |
|
N. macrotis |
UNR 4173 |
GG15 |
Erskine Creek |
Kern |
CA |
35.57532 |
-118.41425 |
|
N. macrotis |
UNR 4174 |
GG16 |
Erskine Creek |
Kern |
CA |
35.57328 |
118.41571 |
|
N. macrotis |
UNR 4170 |
GG12 |
Hungry Valley SRA |
Ventura |
CA |
34.76903 |
118.88293 |
|
N. macrotis |
UNR 4171 |
GG13 |
Hungry Valley SRA |
Ventura |
CA |
34.76903 |
118.88293 |
|
N. macrotis |
UNR 4176 |
GG19 |
Hungry Valley SRA |
Ventura |
CA |
34.74509 |
118.86663 |
|
N. macrotis |
UNR 4177 |
GG20 |
Hungry Valley SRA |
Ventura |
CA |
34.74607 |
118.86717 |
|
N. macrotis |
UNR 4146 |
GG54 |
Lake Isabella |
Kern |
CA |
35.76286 |
118.08183 |
|
N. macrotis |
UNR 4133 |
GG55 |
Lake Isabella |
Kern |
CA |
35.76350 |
118.08179 |
|
N. macrotis |
UNR 4148 |
GG56 |
Lake Isabella |
Kern |
CA |
35.76271 |
118.08214 |
|
N. macrotis |
UNR 4147 |
GG58 |
Lake Isabella |
Kern |
CA |
35.76271 |
118.08215 |
Supplementary material
https://mastozoologiamexicana.com/therya/index.php/THERYA/article/view/6187/1484
Figure 1. Geographic distribution of five species of woodrats that occur in California and the major topographic features that have determined the biogeographic history of biotic diversity in California.
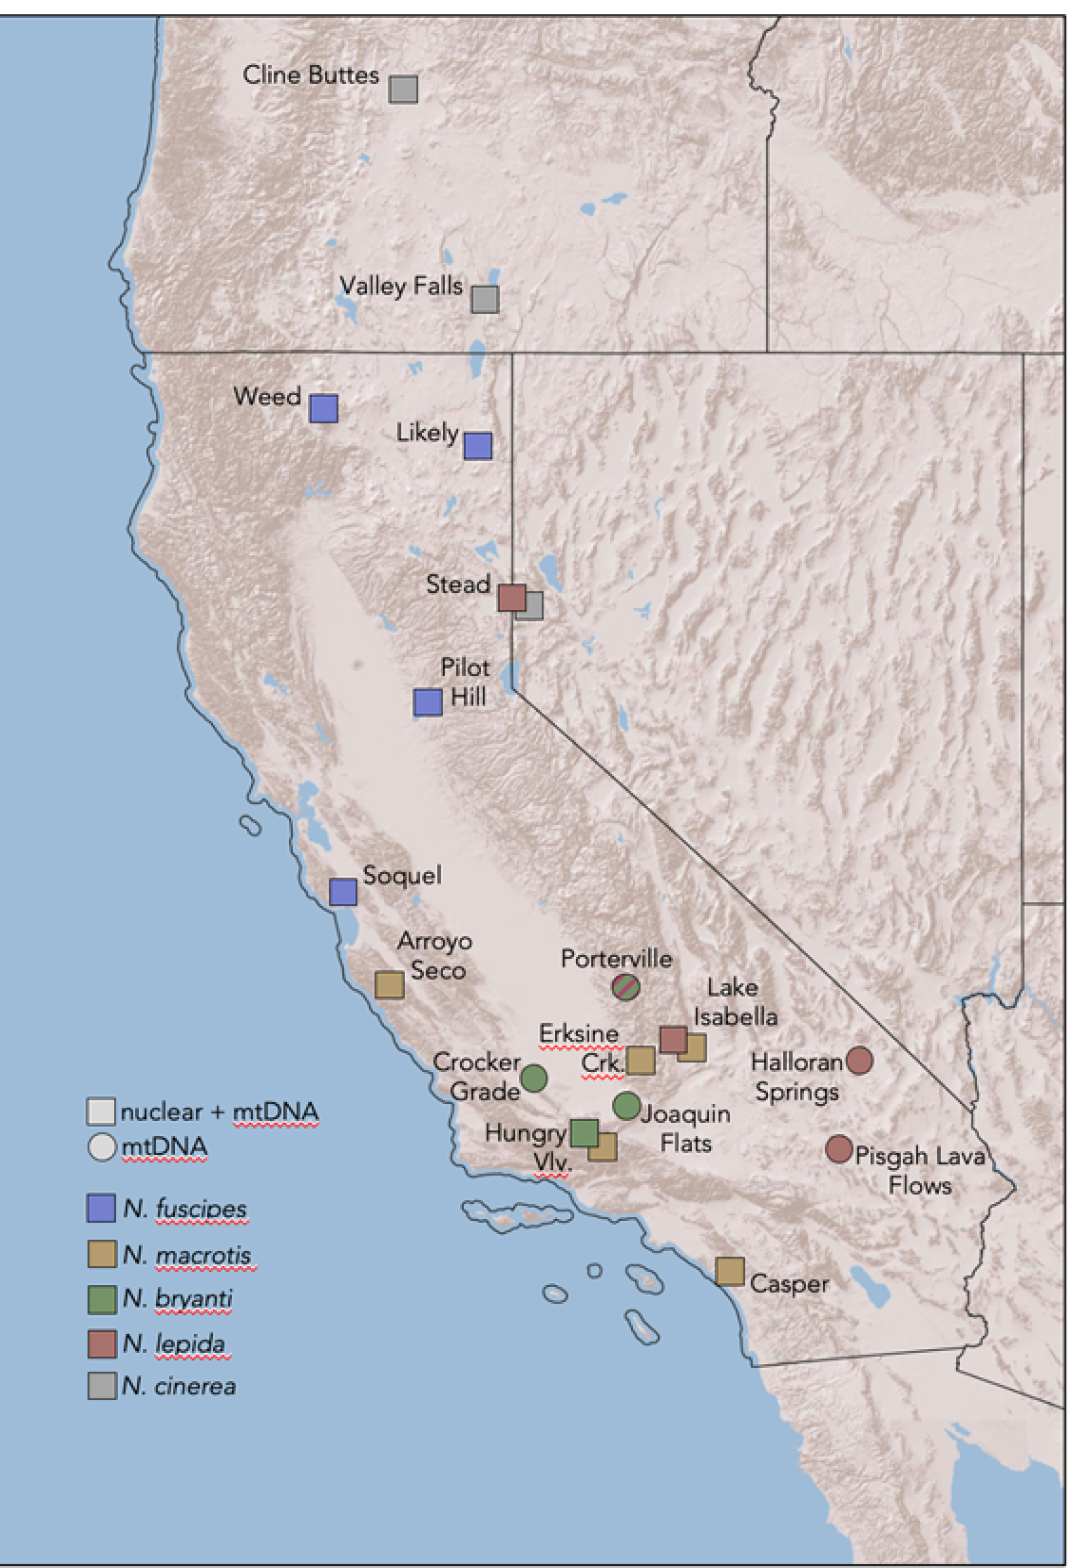
Figure 2. Spatial sampling of nuclear and/or mitochondrial diversity across five species of woodrats in California. Note that the Porterville population is depicted with a combination of colors because N. bryanti of this population and the southern Sierra Nevada, Tehachapi Mountains, and western Mojave Desert region have a N. lepida-like mtDNA.
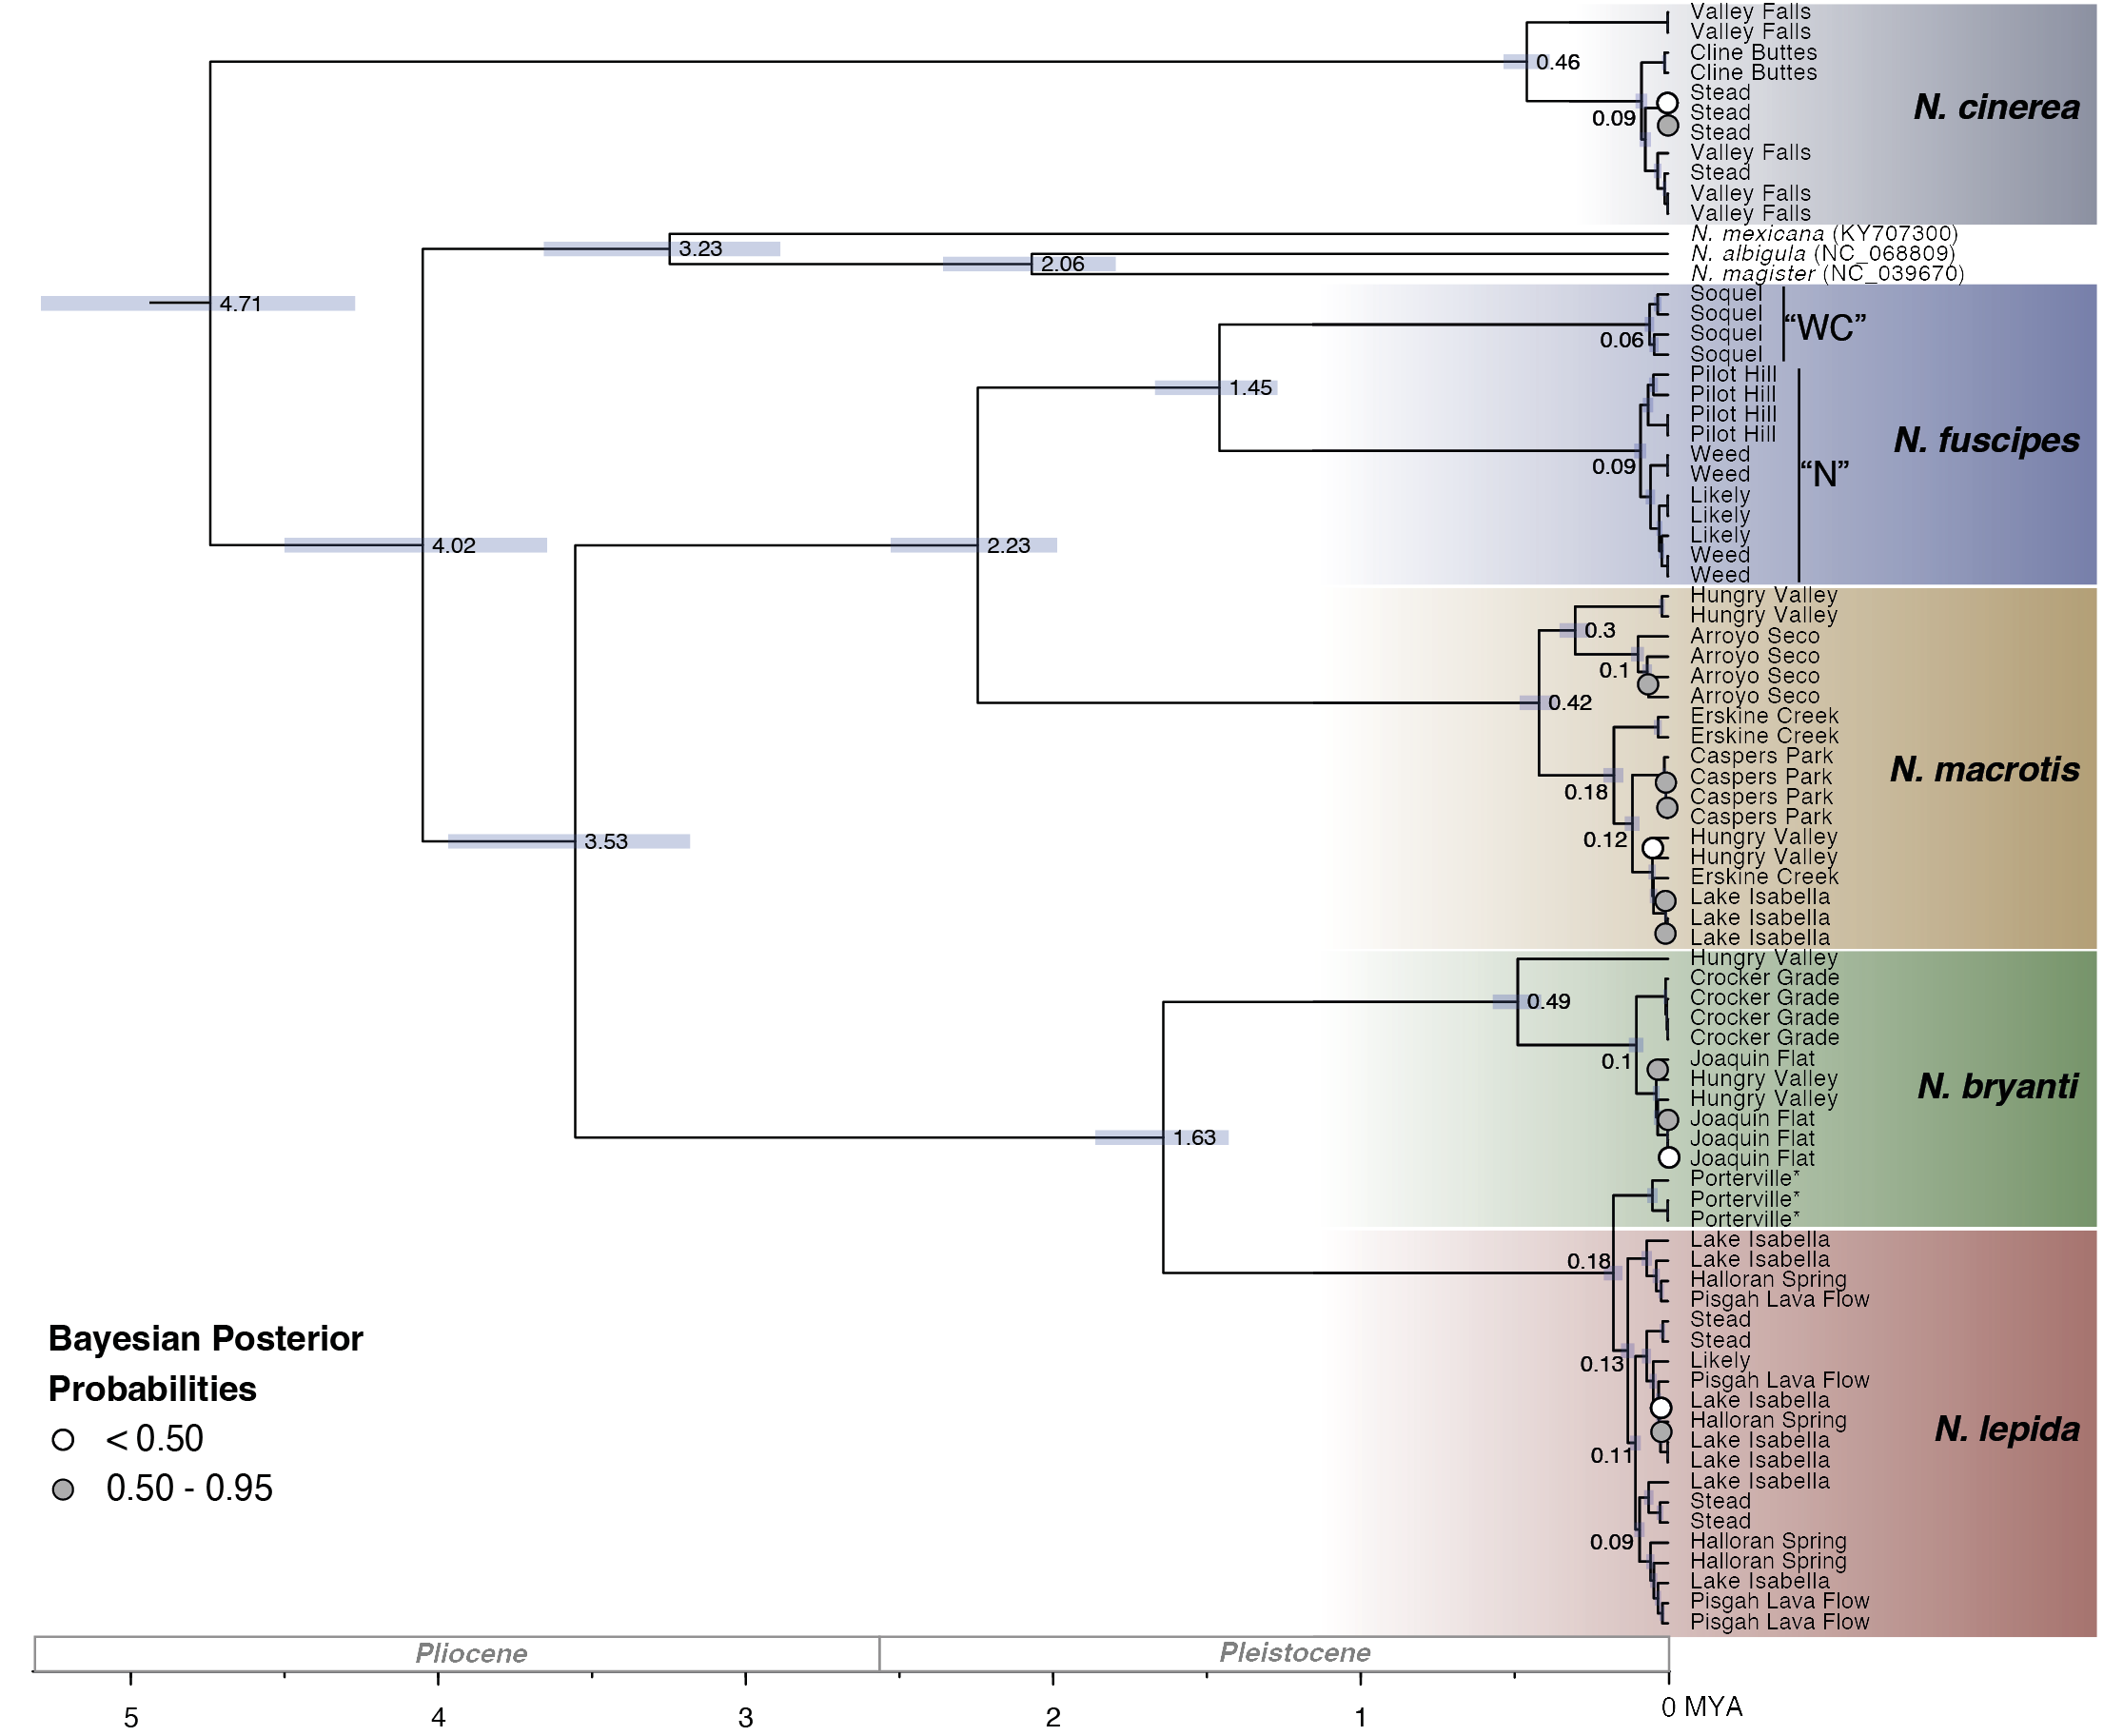
Figure 3. A time-calibrated Bayesian phylogeny estimated using whole mitochondrial genome data in BEAST2. All nodes are supported with > 0.95 Bayesian Posterior Probability except for those shown in white and gray according to the legend. To better visualize focal ingroup taxa divergences, outgroups have been removed but the entire tree is shown in full in Supplemental Figure 1. Nodes are labeled with median ages (in millions of years), with the light blue bars denoting 95 % confidence intervals. Tips from our five focal species are labeled according to collection locality. Additional taxa were included in the analysis and are identified with their GenBank accession numbers. Note that three individuals of N. bryanti from the Porterville locality (indicted by *) fall out within the N. lepida clade. Two clades within N. fuscipes (West-Central, “WC”, and North, “N”) are labeled and discussed in the text.
Table 1. Mitogenome (lower half matrix) and nuclear (upper half matrix) pairwise sequence divergence (uncorrected p-distance) within and between Neotoma lineages. * denotes the Porterville, CA population of N. bryanti that possesses a N. lepida-like mitochondrion; the N. bryanti values do not include the mismatched population.
|
N. fuscipes N |
N. fuscipes WC |
N. macrotis |
N. bryanti |
N. bryanti* |
N. lepida |
N. cinerea |
|
|
N. fuscipes N |
0.004/0.006 |
0.050 |
0.071 |
0.136 |
- |
0.137 |
0.182 |
|
N. fuscipes WC |
0.063 |
0.004/0.004 |
0.059 |
0.124 |
- |
0.127 |
0.170 |
|
N. macrotis |
0.080 |
0.082 |
0.015/0.013 |
0.121 |
- |
0.125 |
0.171 |
|
N. bryanti |
0.107 |
0.106 |
0.104 |
0.008/0.003 |
- |
0.065 |
0.179 |
|
N. bryanti* |
0.108 |
0.110 |
0.107 |
0.069 |
0.002/- |
- |
- |
|
N. lepida |
0.108 |
0.109 |
0.106 |
0.069 |
0.010 |
0.006/0.006 |
0.179 |
|
N. cinerea |
0.121 |
0.122 |
0.124 |
0.125 |
0.123 |
0.122 |
0.011/0.006 |
Figure 4. Maximum-likelihood phylogeny estimated using nuclear SNP data. Nodes with low (<75 %), medium (75 to 95 %), or high (>95 %) bootstrap support are indicated using white, gray, or black circles, respectively. Branch lengths are scaled to substitutions per site. Tips are labeled according to collection locality. The topology we present is mid-point rooted on the longest branch. Two clades within N. fuscipes (West-Central, “WC”, and North, “N”) are also labeled and discussed in the text.
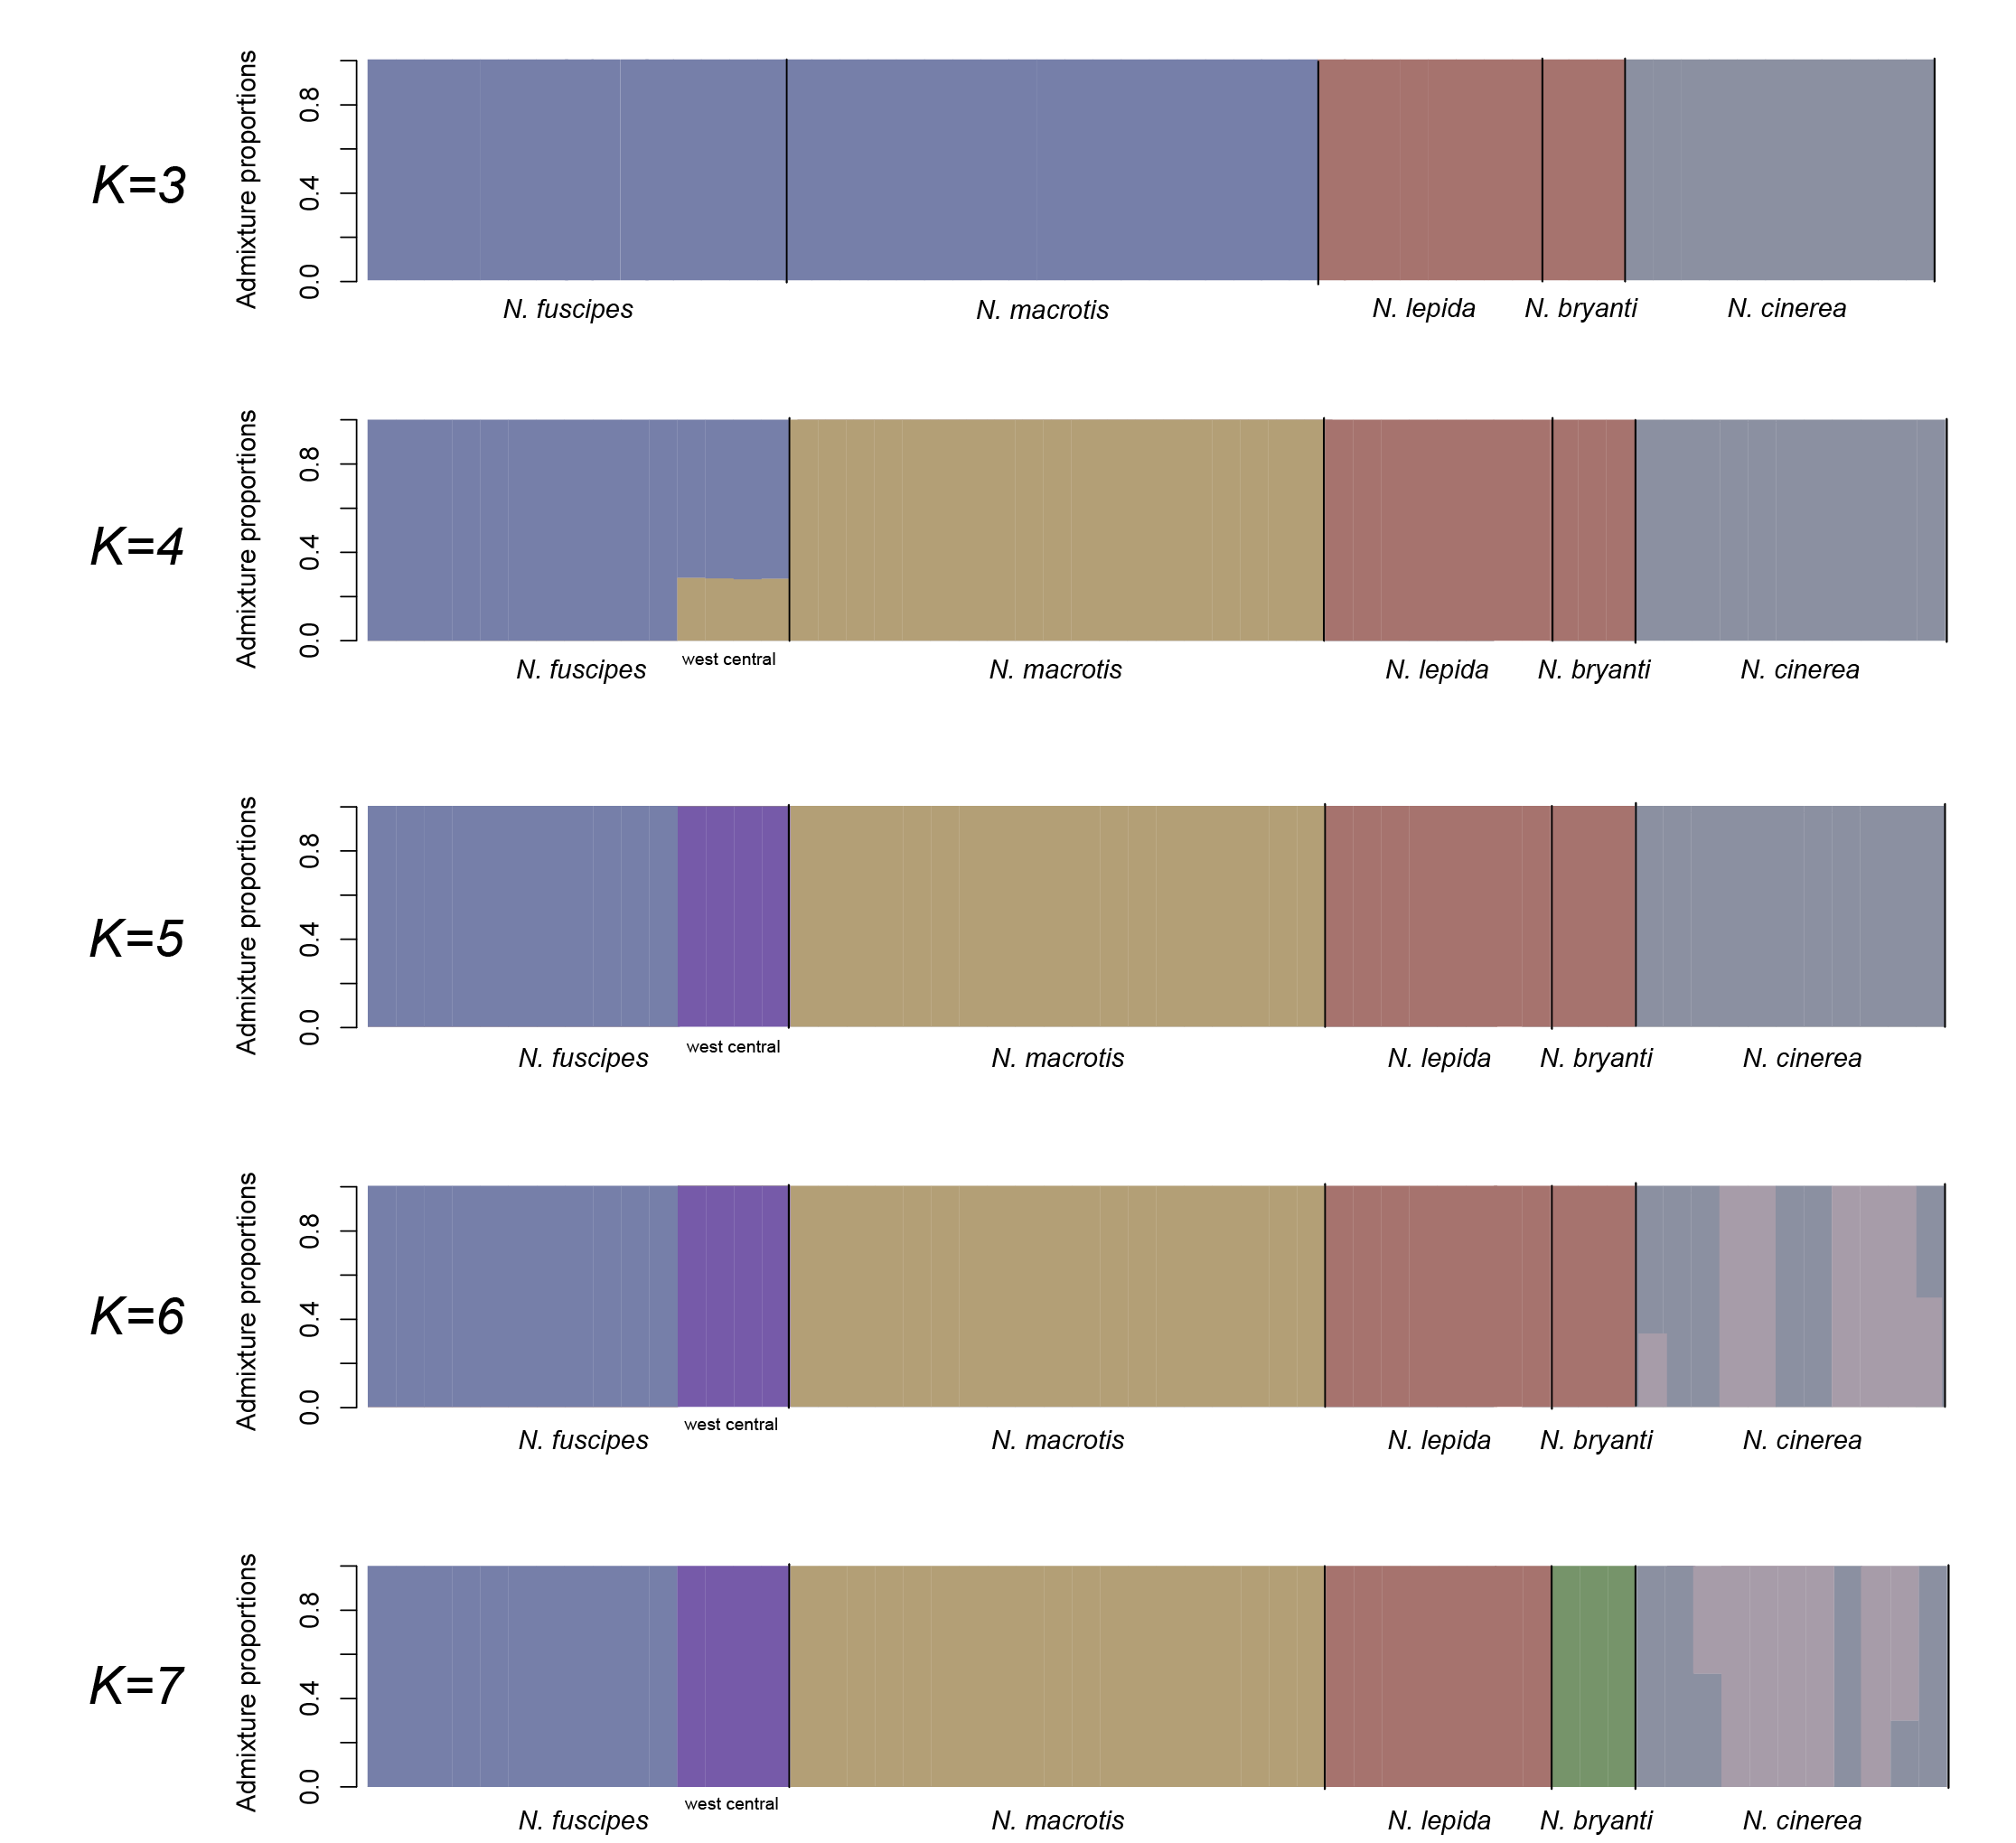
Figure 5. Genomic composition of 56 individual woodrats representing five species of woodrats. K of five and seven received the strongest support.
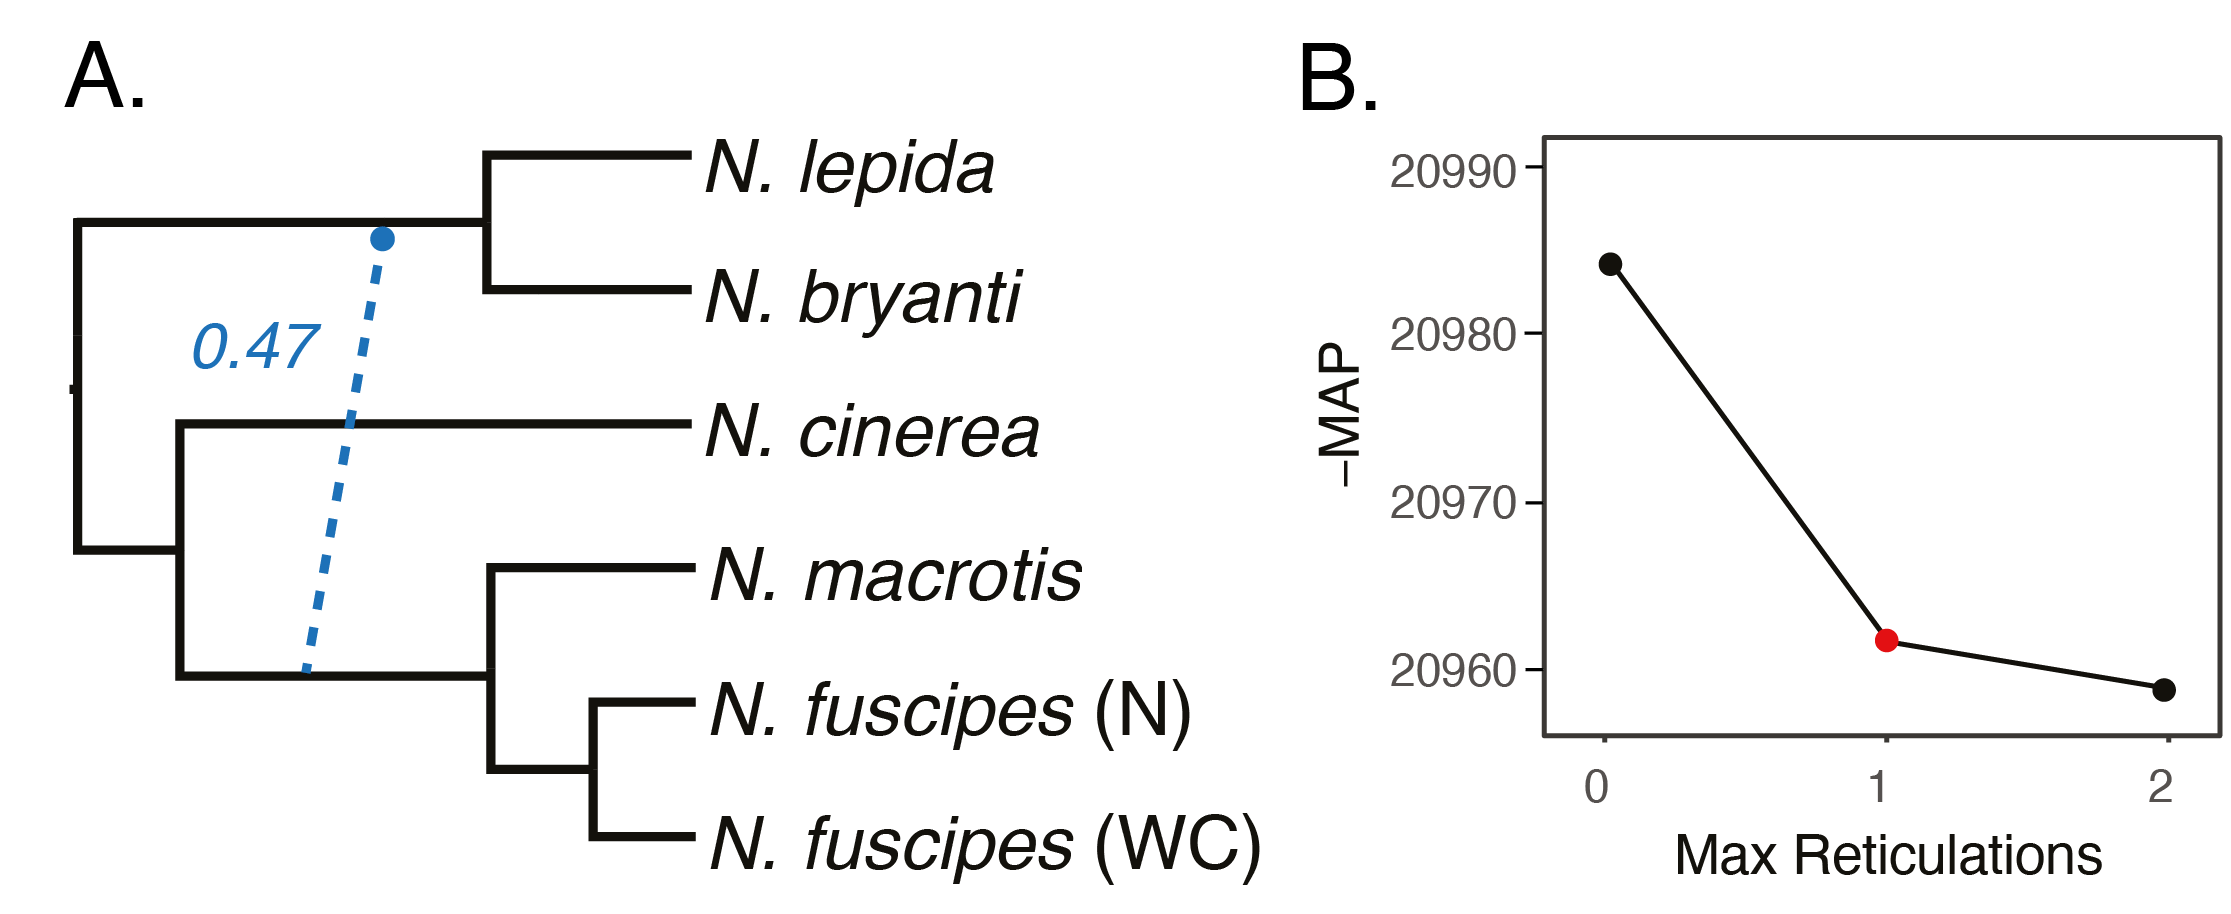
Figure 6. Results of a phylogenetic network analysis performed using PhyloNet (Wen et al. 2008) with one representative individual from each of the focal lineages. A) The best-supported phylogenetic network with a maximum of one reticulation (MR = 1). The blue dotted line depicts the inferred introgression event (inheritance probability: γ = 0.47). B) Negative MAP scores of the best models estimated using MR = 0 - 2. The MR = 1 model was selected (shown in panel A) due to the large improvement in score from MR = 0 to MR = 1.